Visualize your services' Kubernetes runtime using ArgoCD
Port’s ArgoCD integration allows you to model and visualize your Kubernetes deployments managed by ArgoCD, directly in Port.
This guide will help you set up the integration and visualize your services' Kubernetes runtime.
Common use cases
- Developers can easily view the health and status of their services' K8s runtime.
- Platform engineers can create custom views and visualizations for different stakeholders in the organization.
- Platform engineers can set, maintain and track standards for K8s resources.
- R&D managers can track any data about services' K8s resources, using tailor-made views and dashboards.
Prerequisites
- The Git Integration that is relevant for you needs to be installed.
- You will need an accessible k8s cluster. If you don't have one, here is how to quickly set-up a minikube cluster.
- Helm - required to install Port's ArgoCD integration.
Set up data model
To visualize your Kubernetes deployment managed by ArgoCD in Port, we will first install Port's ArgoCD integration which automatically creates ArgoCD-related blueprints and entities in your portal.
Install Port's ArgoCD integration
-
Go to your data sources page, click on
+ Data source, find theKubernetes Stackcategory and selectArgoCD. -
Follow the installation command for your preferred installation method:
- Helm
- ArgoCD
To install the integration using Helm:
-
Go to the Argocd data source page in your portal.
-
Select the
Real-time and always onmethod: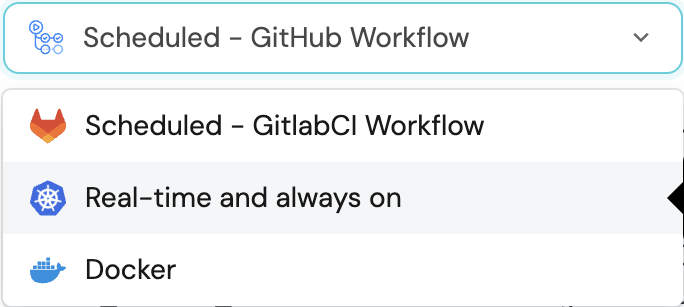
-
A
helmcommand will be displayed, with default values already filled out (e.g. your Port client ID, client secret, etc).
Copy the command, replace the placeholders with your values, then run it in your terminal to install the integration.
BaseUrl & webhook configuration
AppHost deprecationintegration.config.appHostis deprecated: Please useliveEvents.baseUrlfor webhook URL settings instead.In order for the Argocd integration to update the data in Port on real-time changes in Argocd, you need to specify the
liveEvents.baseUrlparameter. TheliveEvents.baseUrlparameter should be set to theurlof your Argocd integration instance. Your integration instance needs to have the option to setup webhooks via http requests/recieve http requests , so please configure your network accordingly.Debugging local integrationsTo test webhooks or live event delivery to your local environment, expose your local pod or service to the internet using ngrok:
ngrok http http://localhost:8000This will provide a public URL you can use for webhook configuration and external callbacks during development.
If
liveEvents.baseUrlis not provided, the integration will continue to function correctly. In such a configuration, to retrieve the latest information from the target system, thescheduledResyncIntervalparameter has to be set, or a manual resync will need to be triggered through Port's UI.Scalable Mode for Large Integrations
If you are deploying the integration at scale and want to decouple the resync process from the live events process (recommended for large or high-throughput environments), you can enable scalable mode by adding the following flags to your Helm install command:
  --set workload.kind="CronJob"  \
  --set workload.cron.resyncTimeoutMinutes=60  \
  --set scheduledResyncInterval="'*/60 * * * *'"  \
  --set liveEvents.worker.enabled=true
Selecting a Port API URL by account regionThe
port_region,port.baseUrl,portBaseUrl,port_base_urlandOCEAN__PORT__BASE_URLparameters are used to select which instance of Port API will be used.Port exposes two API instances, one for the EU region of Port, and one for the US region of Port.
- If you use the EU region of Port (https://app.port.io), your API URL is
https://api.port.io. - If you use the US region of Port (https://app.us.port.io), your API URL is
https://api.us.port.io.
To install the integration using ArgoCD, follow these steps:
-
Create a
values.yamlfile inargocd/my-ocean-argocd-integrationin your git repository with the content:Variable ReplacementRemember to replace the placeholders for
TOKENandSERVER_URL, which represents your ArgoCD API token and server url respectively. Ensure that the token has sufficient permissions to read ArgoCD resources. You can configure the RBAC policy for the token user by following this guideinitializePortResources: true
scheduledResyncInterval: 120
integration:
identifier: my-ocean-argocd-integration
type: argocd
eventListener:
type: POLLING
config:
serverUrl: SERVER_URL
secrets:
token: TOKEN
-
Install the
my-ocean-argocd-integrationArgoCD Application by creating the followingmy-ocean-argocd-integration.yamlmanifest:Variable ReplacementRemember to replace the placeholders for
YOUR_PORT_CLIENT_IDYOUR_PORT_CLIENT_SECRETandYOUR_GIT_REPO_URL.Multiple sources ArgoCD documentation can be found here.
ArgoCD Application
apiVersion: argoproj.io/v1alpha1
kind: Application
metadata:
  name: my-ocean-argocd-integration
  namespace: argocd
spec:
  destination:
    namespace: my-ocean-argocd-integration
    server: https://kubernetes.default.svc
  project: default
  sources:
  - repoURL: 'https://port-labs.github.io/helm-charts/'
    chart: port-ocean
    targetRevision: 0.1.18
    helm:
      valueFiles:
      - $values/argocd/my-ocean-argocd-integration/values.yaml
      parameters:
        - name: port.clientId
          value: YOUR_PORT_CLIENT_ID
        - name: port.clientSecret
          value: YOUR_PORT_CLIENT_SECRET
        - name: port.baseUrl
          value: https://api.getport.io
  - repoURL: YOUR_GIT_REPO_URL
    targetRevision: main
    ref: values
  syncPolicy:
    automated:
      prune: true
      selfHeal: true
    syncOptions:
    - CreateNamespace=true
Selecting a Port API URL by account regionThe
port_region,port.baseUrl,portBaseUrl,port_base_urlandOCEAN__PORT__BASE_URLparameters are used to select which instance of Port API will be used.Port exposes two API instances, one for the EU region of Port, and one for the US region of Port.
- If you use the EU region of Port (https://app.port.io), your API URL is
https://api.port.io. - If you use the US region of Port (https://app.us.port.io), your API URL is
https://api.us.port.io.
- If you use the EU region of Port (https://app.port.io), your API URL is
-
Apply your application manifest with
kubectl:kubectl apply -f my-ocean-argocd-integration.yaml
What does the integration do?
After installation, the integration will:
-
Create blueprints in your Builder (as defined here) that represent ArgoCD resources:
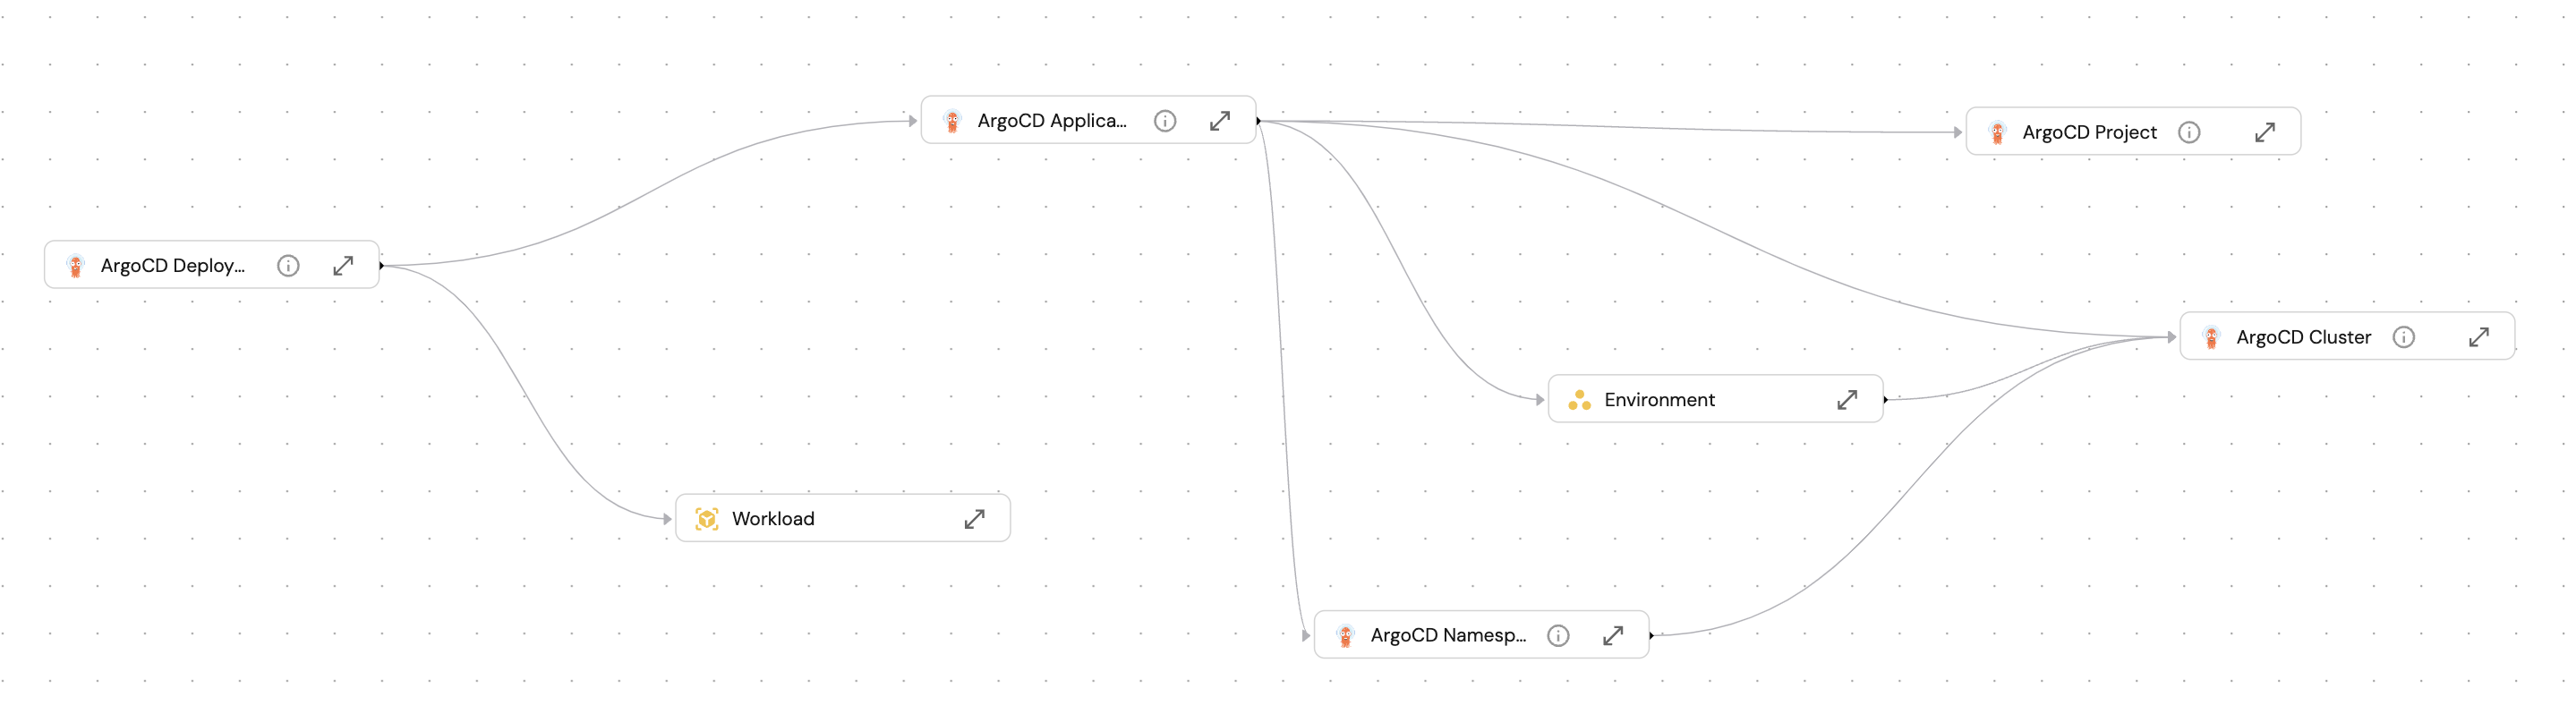
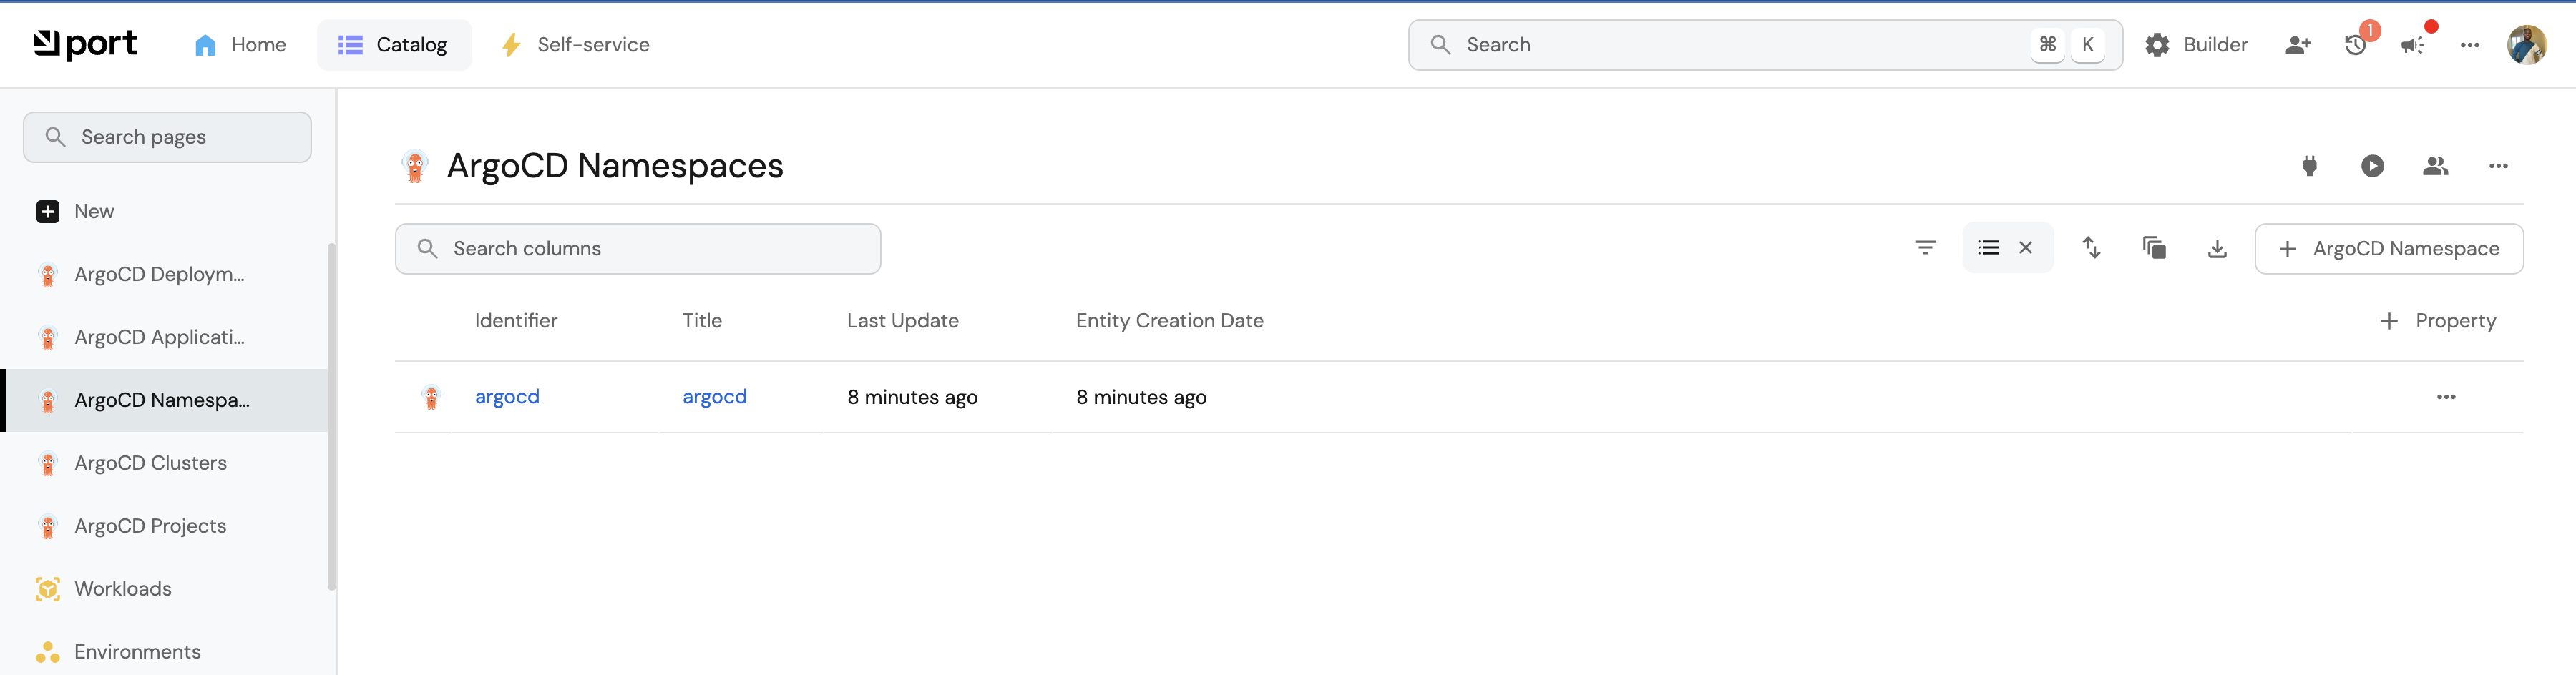
-
Create entities in your Software catalog. You will see a new page for each blueprint containing your resources, filled with data from your Kubernetes cluster (according to the default mapping that is defined here):
-
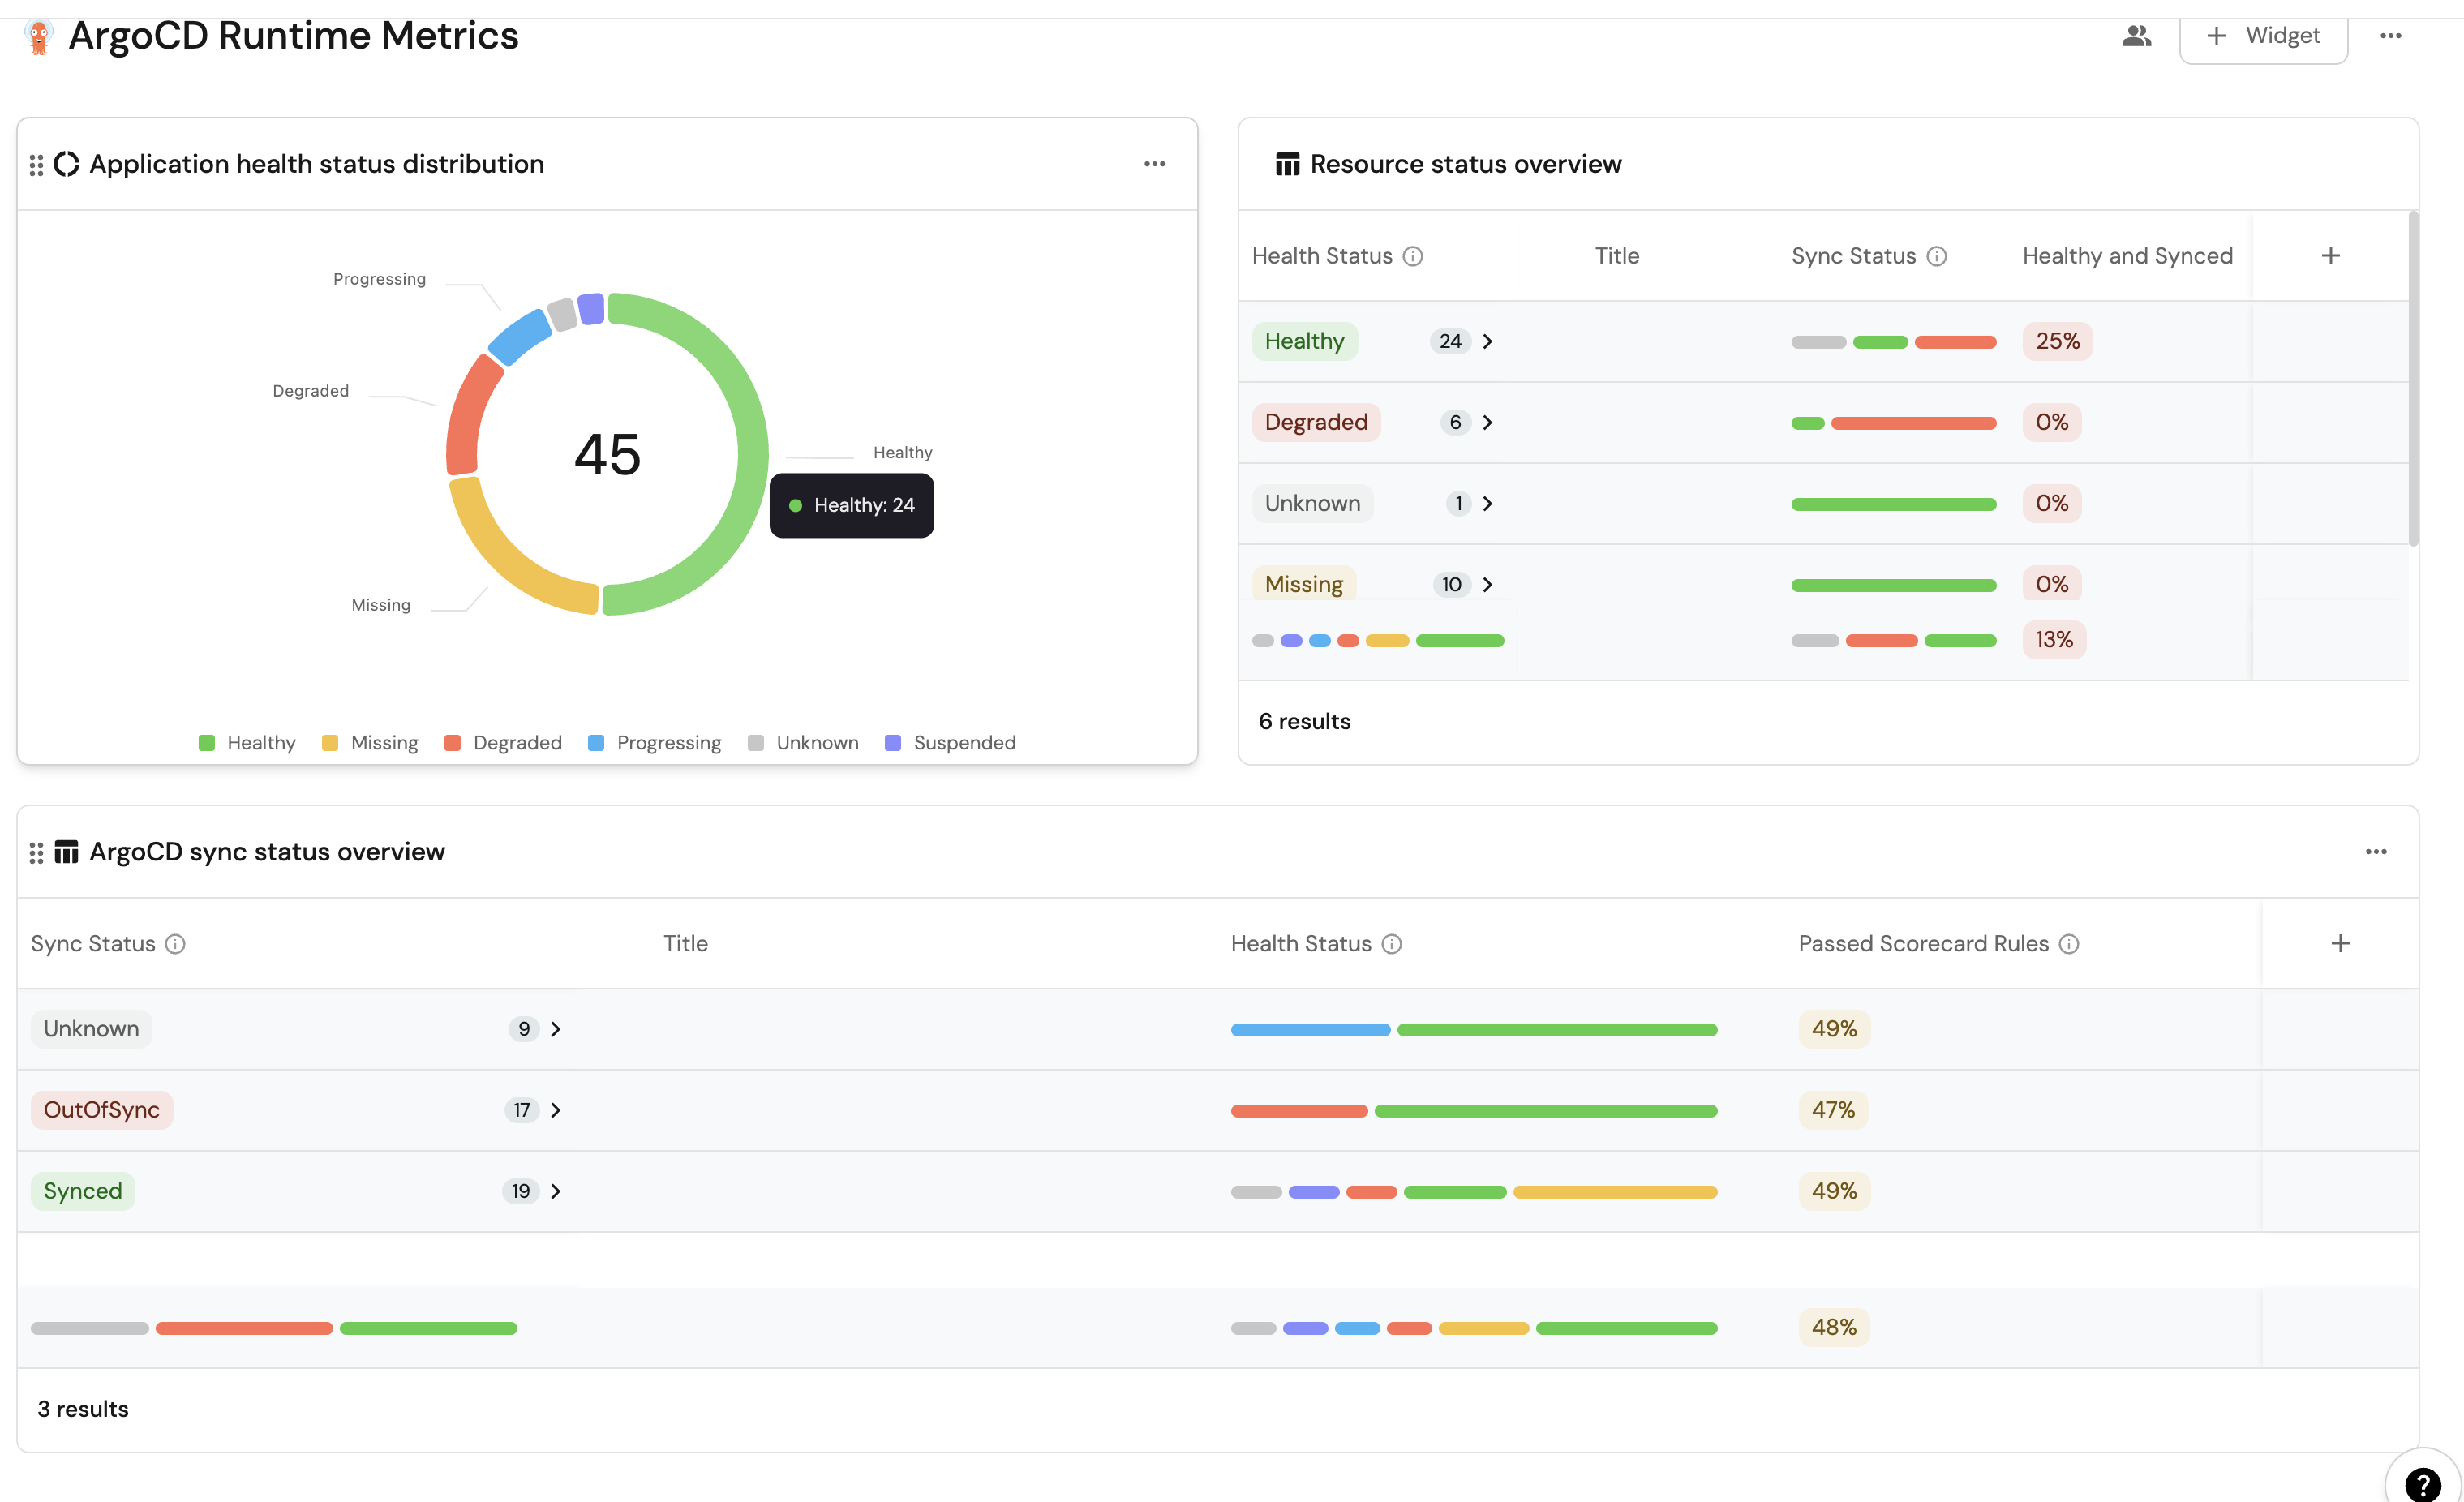
Create a dashboard in your software catalog that provides you with some visual views of the data ingested from your K8s cluster.
-
Listen to changes in your ArgoCD resources and update your entities accordingly.
Set up automatic discovery
After onboarding, the relationship between the workload blueprint and the service blueprint is established automatically.
The next step is to configure automatic discovery to ensure that each workload entity is properly related to its respective service entity.
You may have noticed that the service relation is empty for all of our workload entities. This is because we haven't specified which workload belongs to which service. This can be done manually, or via mapping by using a convention of your choice.
In this guide we will use the following convention:
An Argo application with a label in the form of portService: <service-identifier> will automatically be assigned to a service with that identifier.
For example, an ArgoCD application with the label portService: awesomeService will be assigned to a service with the identifier awesomeService.
To achieve this, we need to update the ArgoCD integration's mapping configuration:
-
Go to your data sources page, find the ArgoCD exporter card, click on it and you will see a YAML editor showing the current configuration. Add the following block to the mapping configuration and click
Resync:- kind: application
selector:
query: 'true'
port:
entity:
mappings:
identifier: .metadata.labels.portService
blueprint: '"workload"'
properties: {}
relations:
service: .metadata.labels.portService
-
Go to the services page of your software catalog. Click on the
servicefor which you created the deployment. At the bottom of the page, you will see theworkloadrelated to this service, along with all of their data: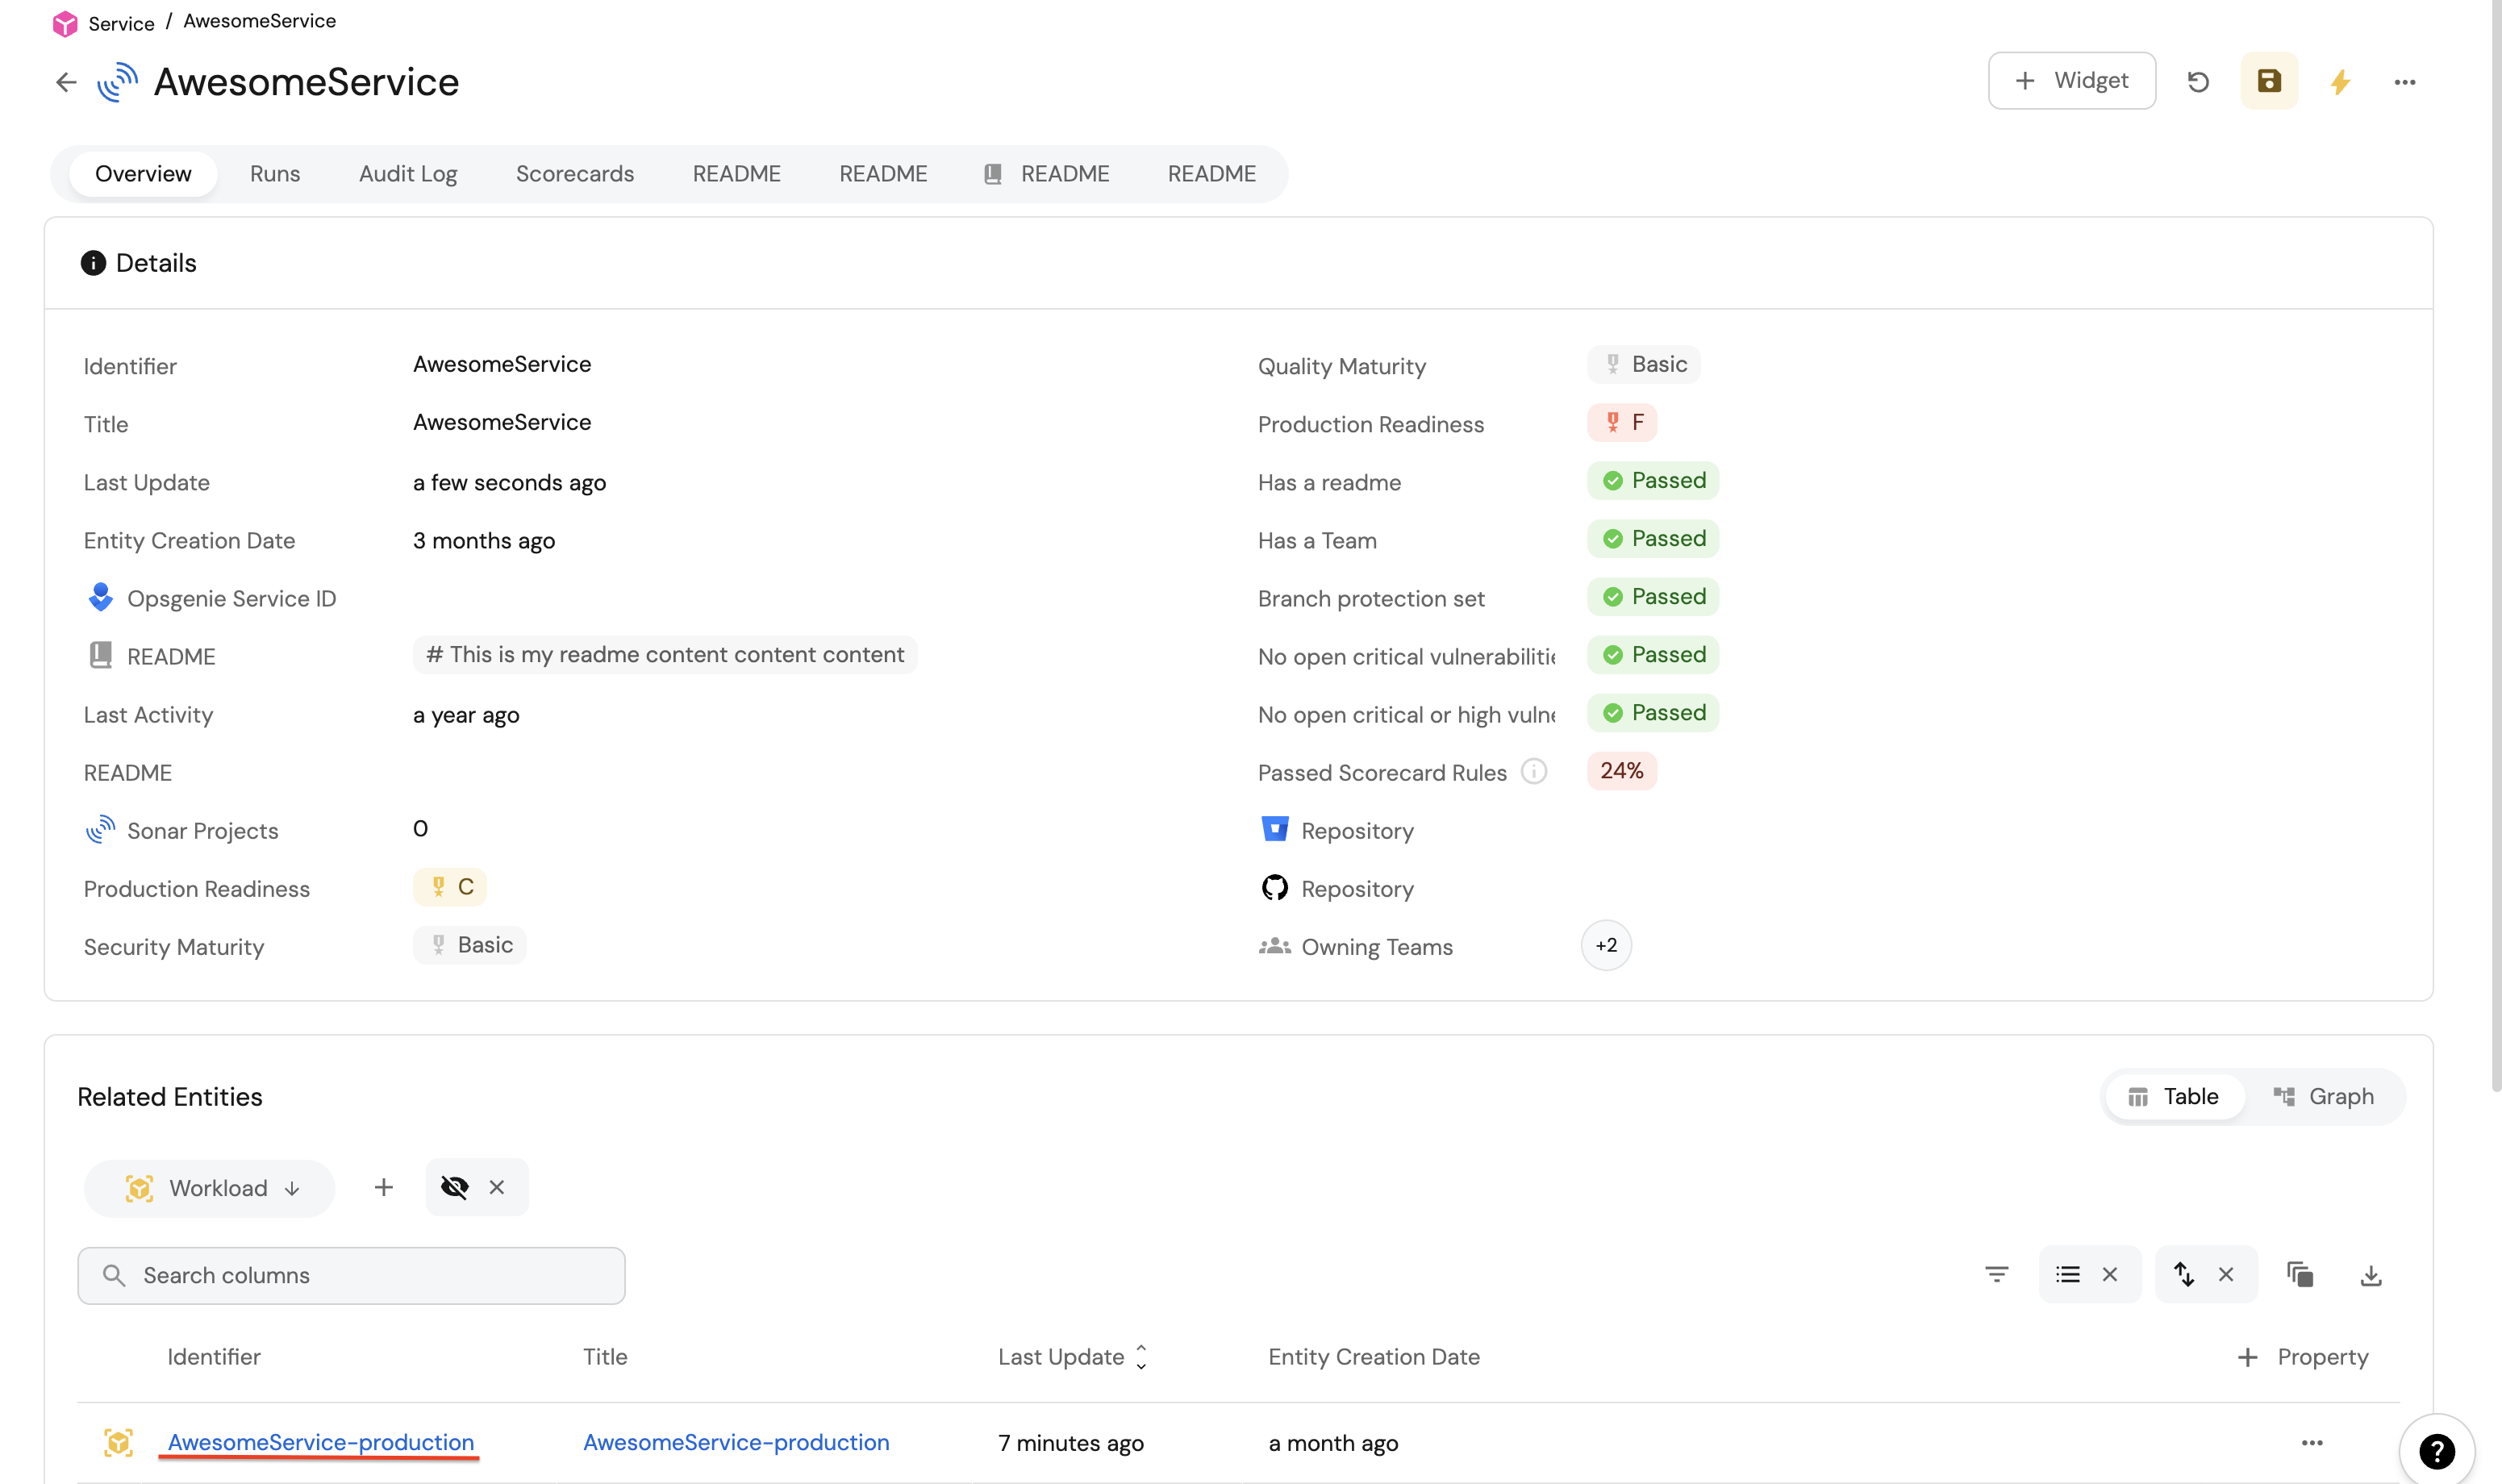
Visualization
By leveraging Port's dashboards, you can create custom views to track your ArgoCD runtime metrics and monitor your applications' performance over time.
Set up dashboard
-
Go to your software catalog.
-
Click on the
+ Newbutton in the left sidebar. -
Select New dashboard.
-
Name the dashboard ArgoCD Runtime Metrics.
-
Choose an icon (optional).
-
Click
Create.
Add widgets
In your new dashboard, create the following widgets:
ArgoCD sync status overview (click to expand)
-
Click
+ Widgetand select Table. -
Title:
ArgoCD sync status overview. -
Choose an icon (optional).
-
Select Workload as the Blueprint.
-
Click on
Save. -
Click on the three dots on the widget and select
Customize table. -
Click on the
Group by any Columnicon and select Sync Status. -
Click on the
Manage propertiesand add the following:- Title
- Health Status
- Passed scorecard rules
-
Click on the
Saveicon.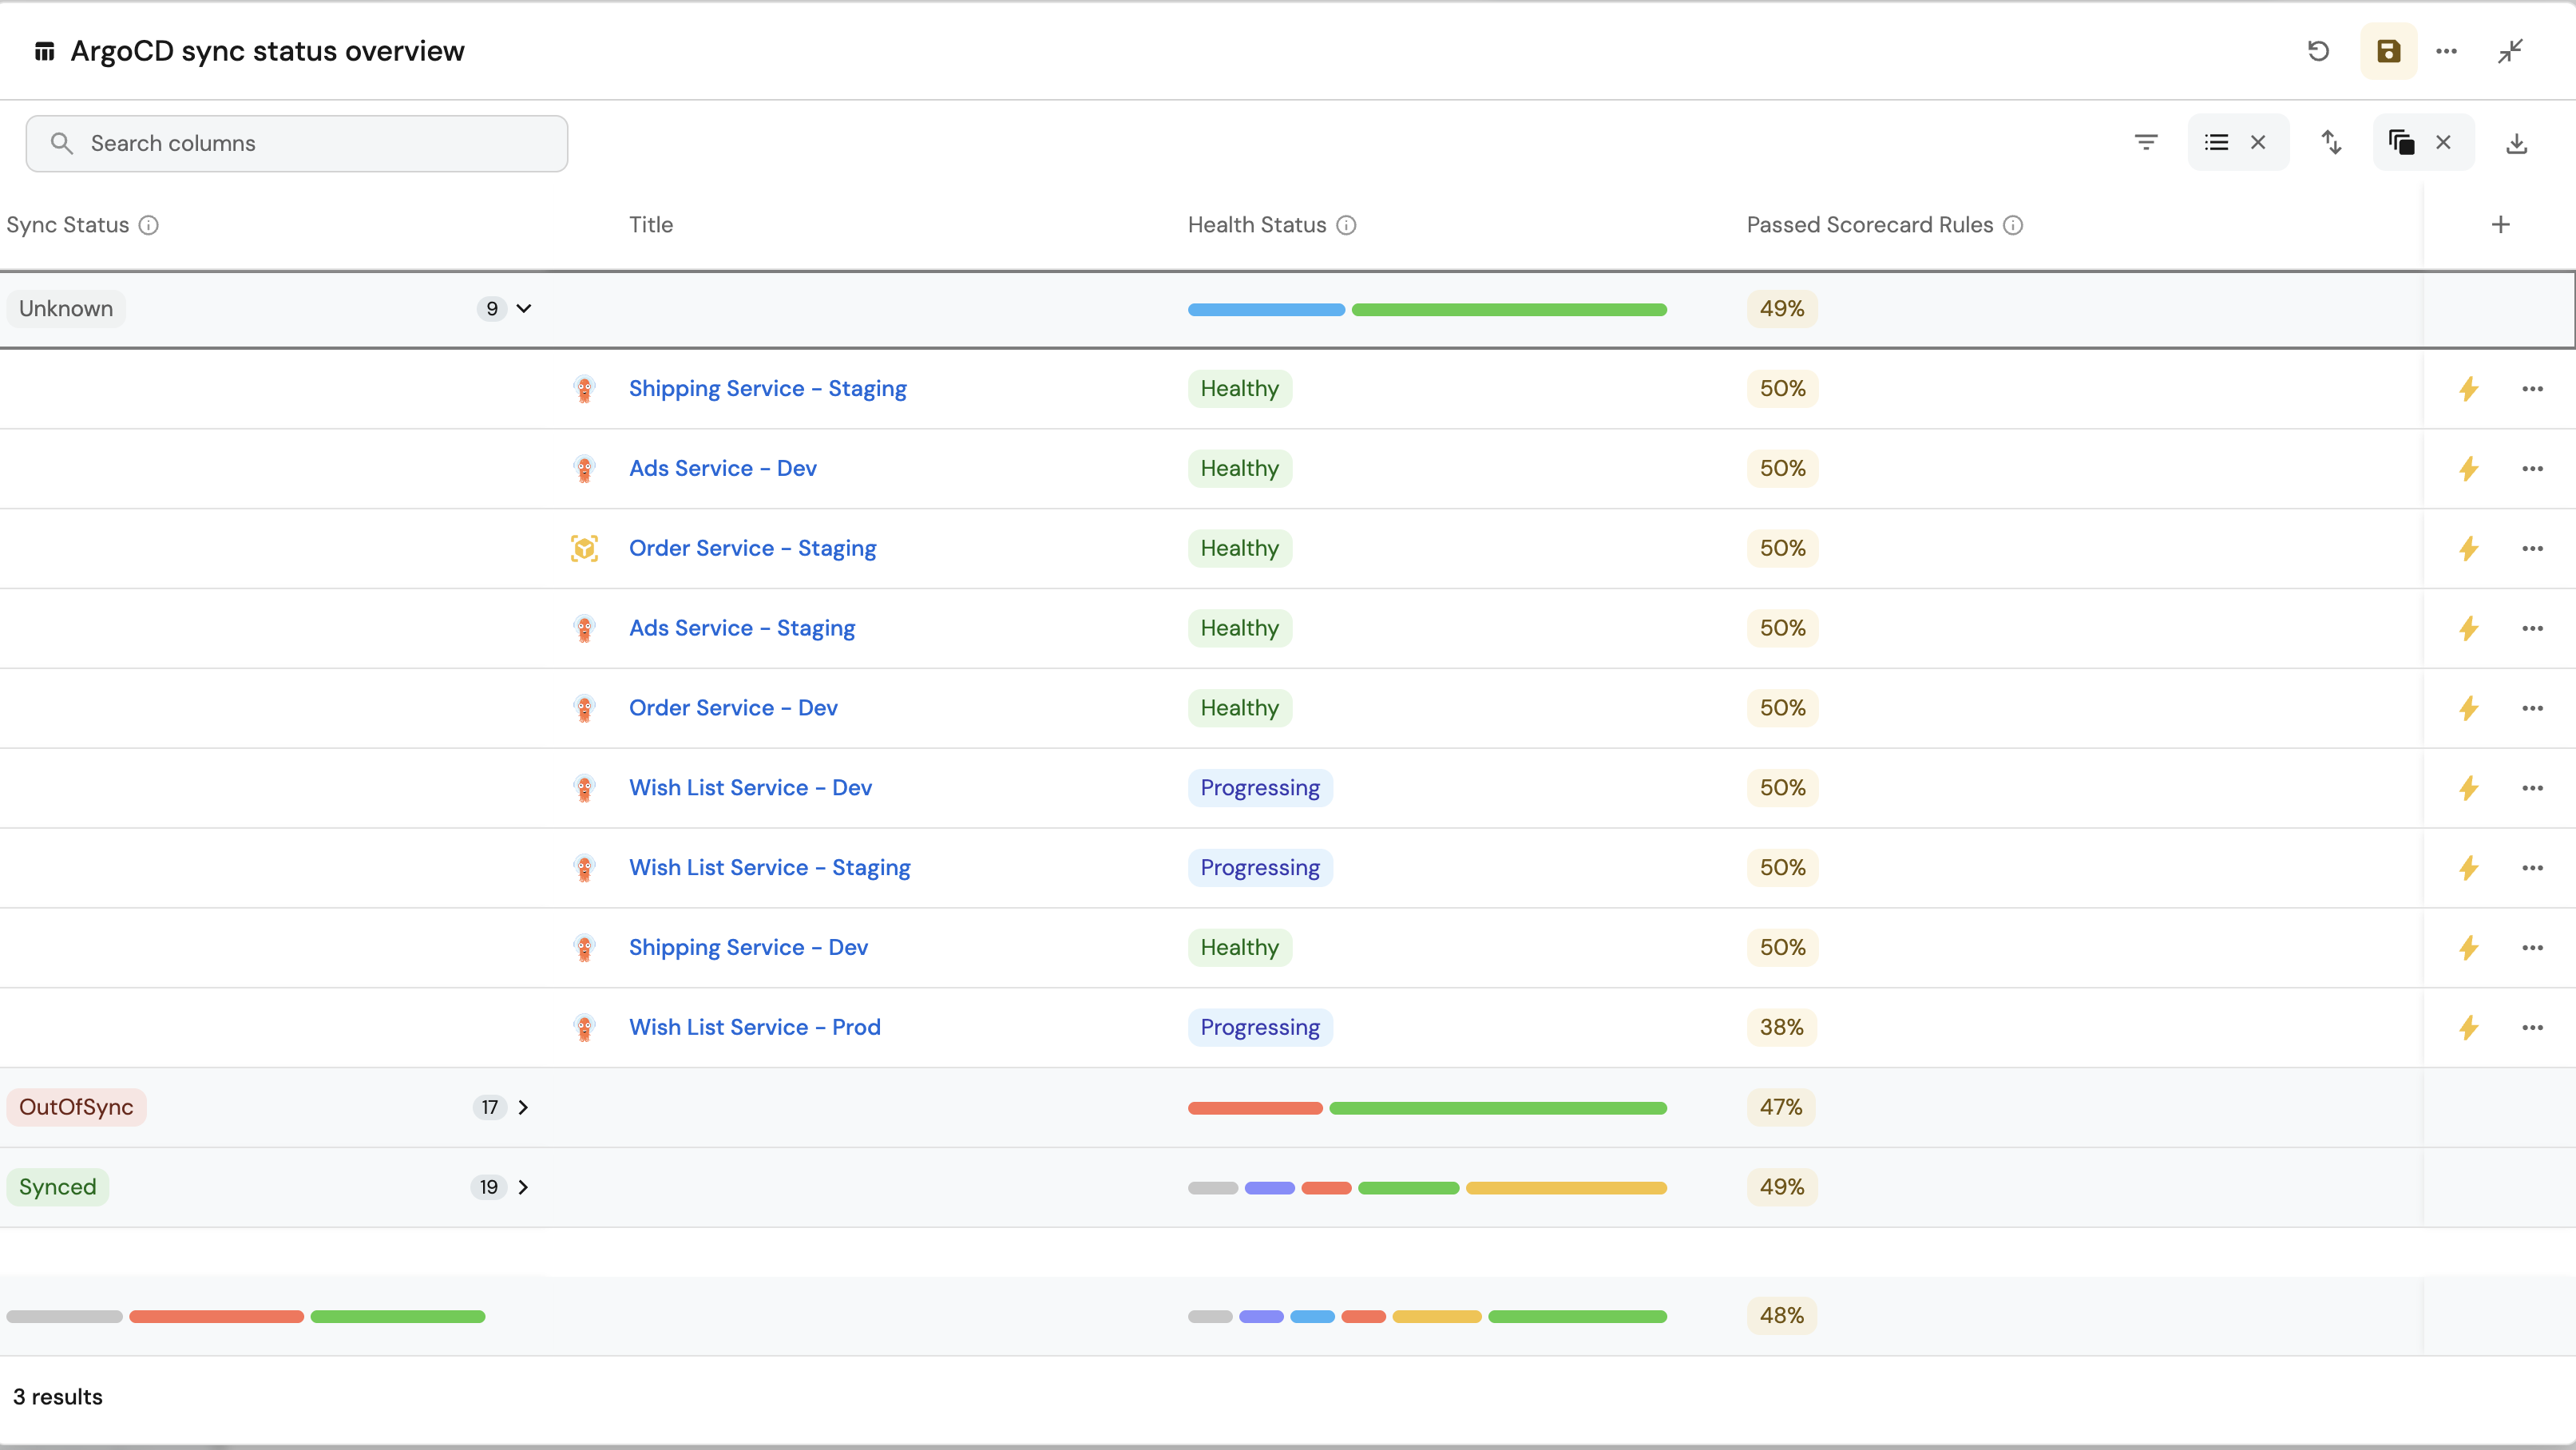
Health status distribution (click to expand)
-
Click
+ Widgetand select Pie Chart. -
Title:
Application health status distribution. -
Choose an icon (optional).
-
Select Workload as the Blueprint.
-
Choose
Health Statusas the Breakdown by property. -
Click on
Save.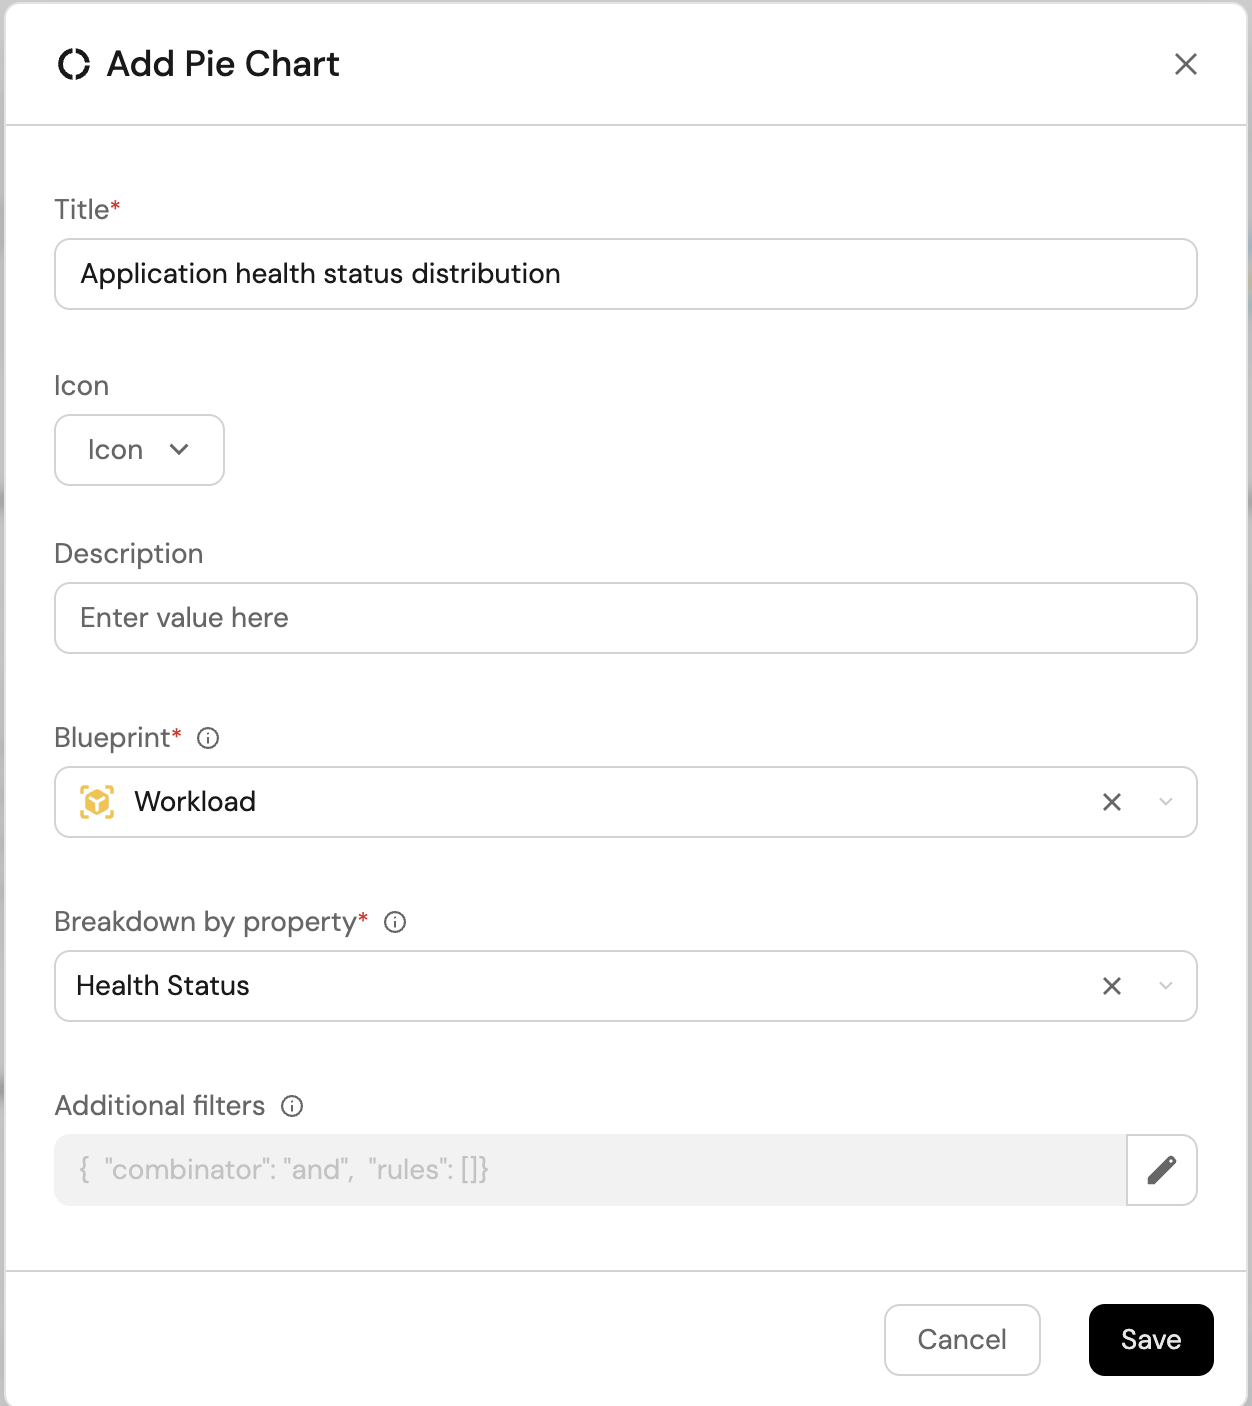
Resource health status overview (click to expand)
-
Click
+ Widgetand select Table. -
Title:
Resource health status overview. -
Choose an icon (optional).
-
Select Workload as the Blueprint.
-
Click on
Save. -
Click on the three dots on the widget and select
Customize table. -
Click on the
Group by any Columnicon and select Health Status. -
Click on the
Manage propertiesand add the following:- Title
- Sync Status
- Health and Synced
-
Click on the
Saveicon.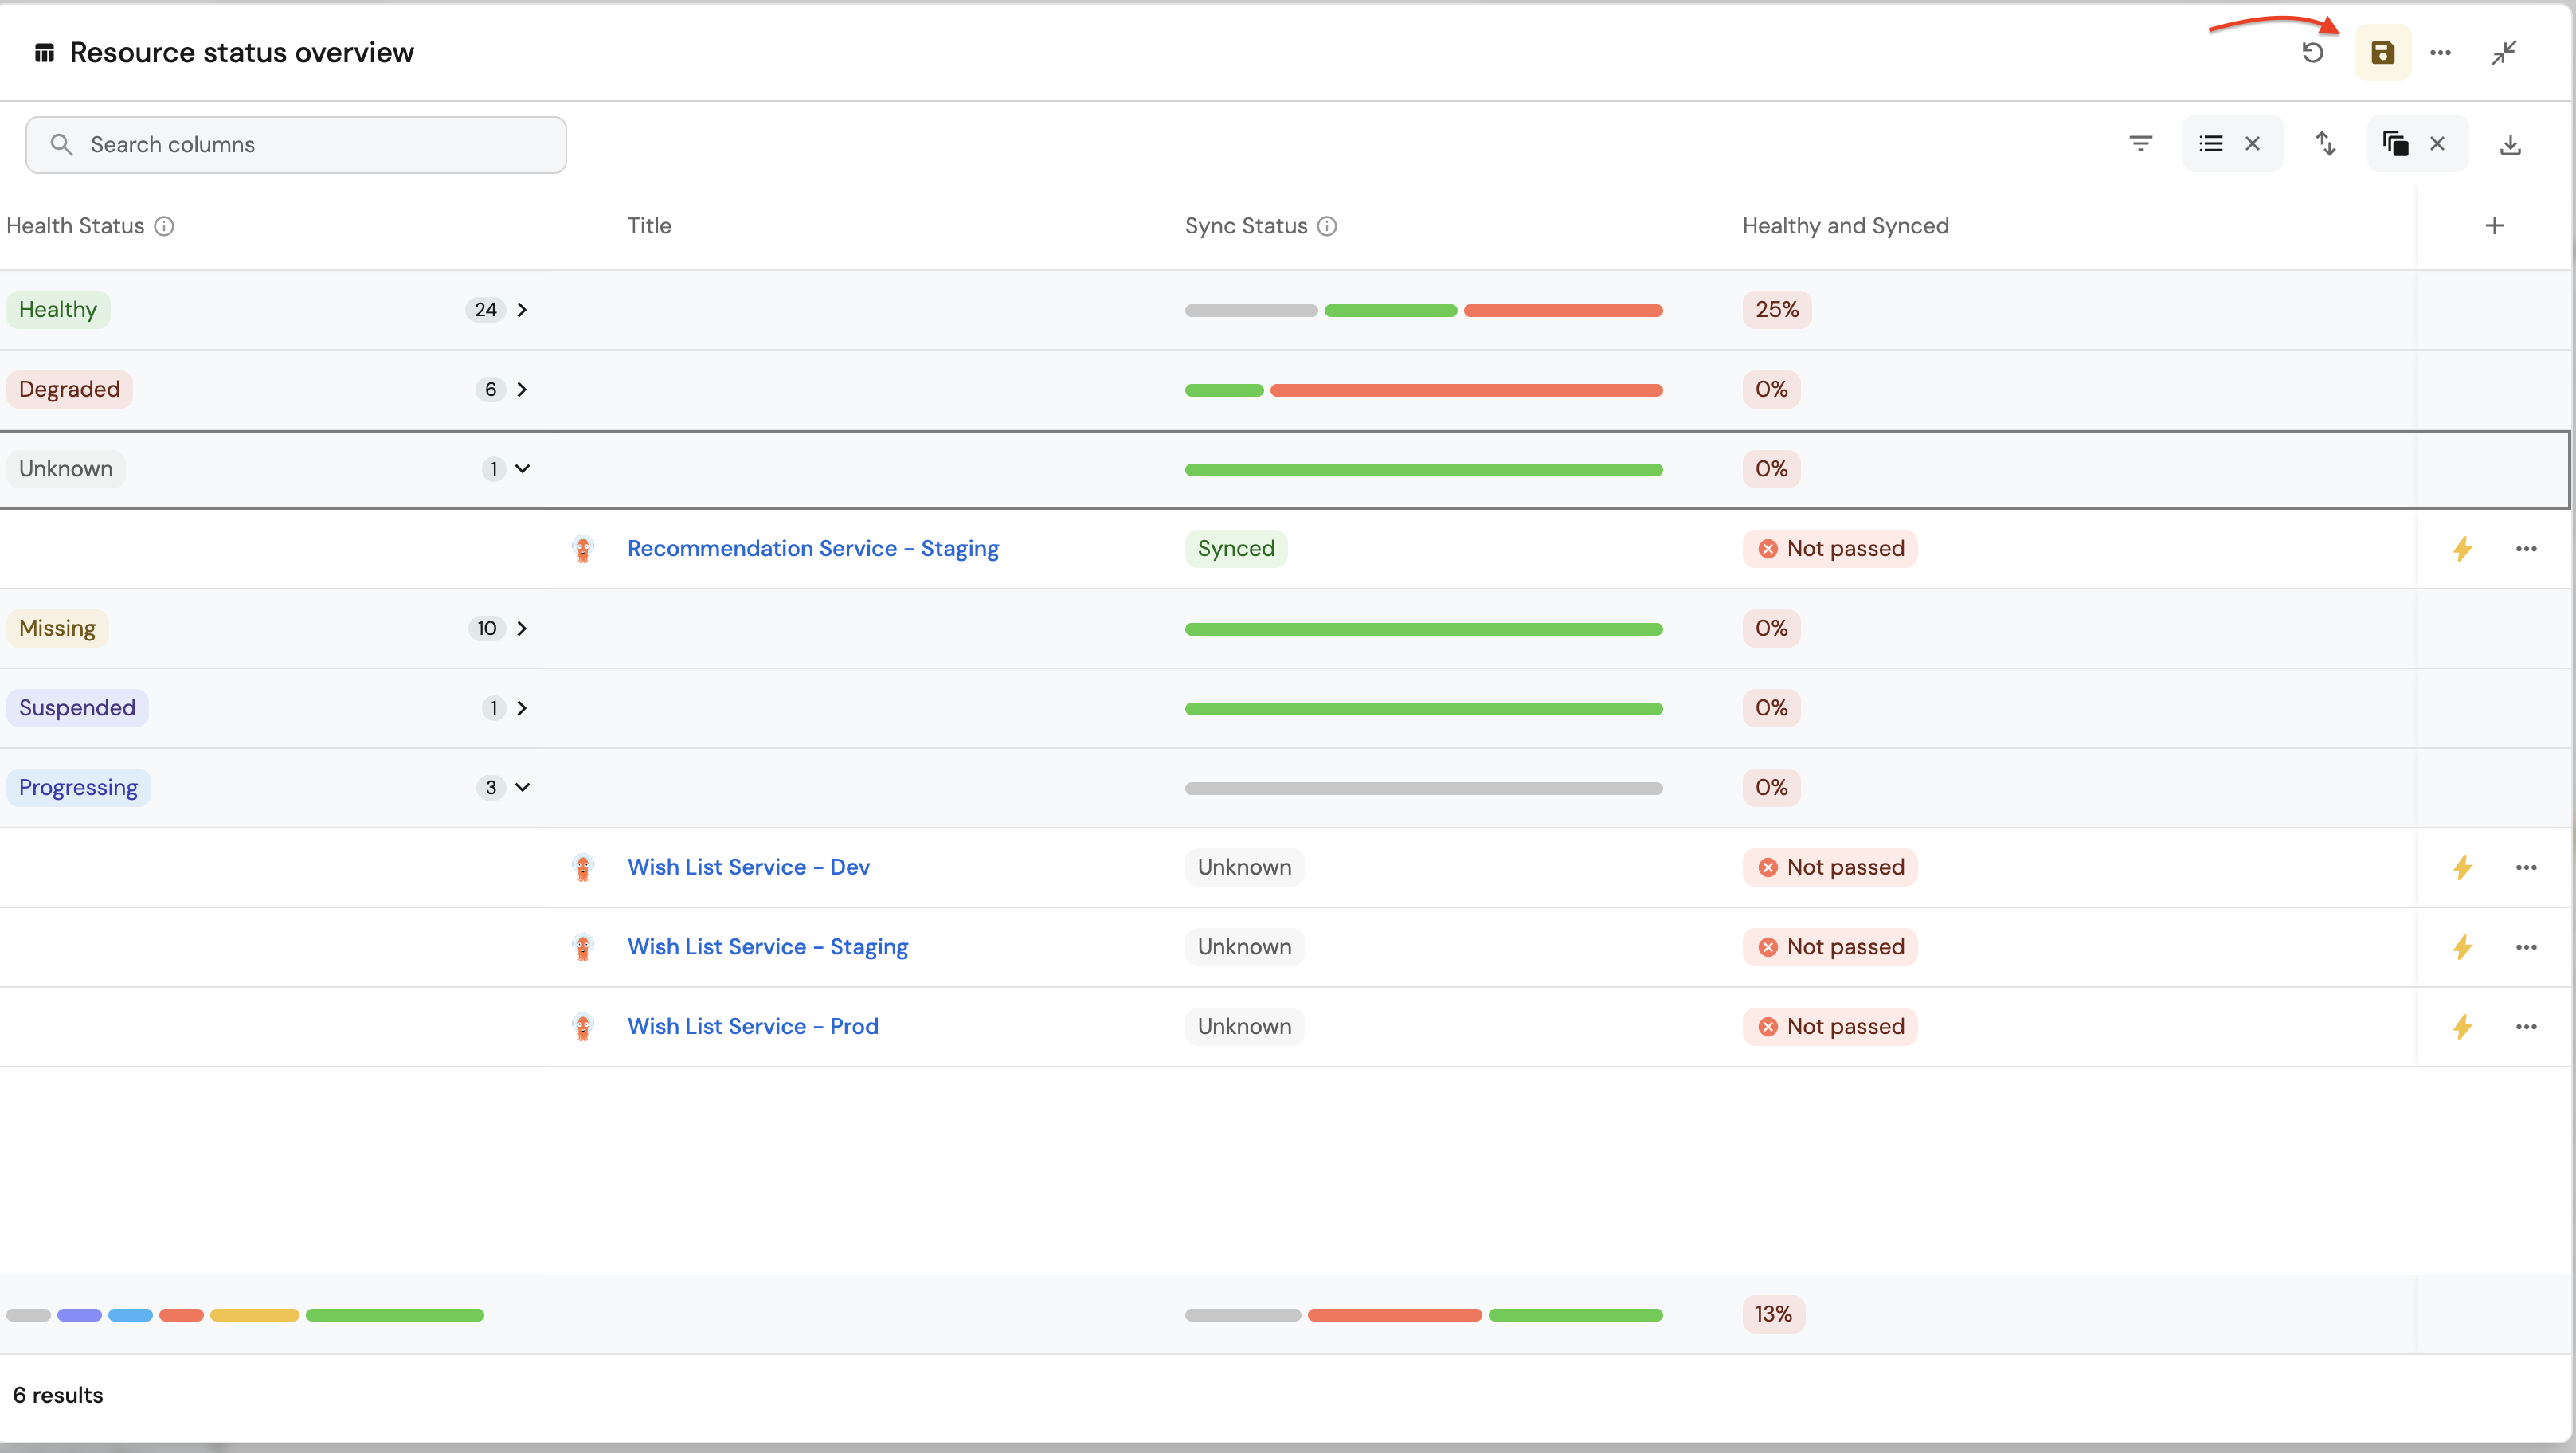
These widgets will give you a comprehensive view of your ArgoCD runtime, making it easy to monitor application health, sync status, and deployment progress across your cluster.
Possible daily routine integrations
- Send a slack message in the R&D channel to let everyone know that a new deployment was created.
- Notify Devops engineers when a service's availability drops.
- Send a weekly/monthly report to R&D managers displaying the health of services' production runtime.
Conclusion
Kubernetes is a complex environment that requires high-quality observability. Port's ArgoCD integration allows you to easily model and visualize your ArgoCD & Kubernetes resources, and integrate them into your daily routine.
Customize your views to display the data that matters to you, grouped or filtered by teams, namespaces, or any other criteria.