Visualize your GitHub repository and developer activity
This guide demonstrates how to set up a monitoring solution to get insights into your GitHub workspace using Port's GitHub integration. You'll learn how to visualize repository visibility, monitor pull requests and issues, and track developer activity over time.
Common use cases
- Visualize and monitor repository visibility (e.g., public vs. private).
- Track developer engagement through pull requests and issues.
Prerequisites
This guide assumes the following:
- You have a Port account and have completed the onboarding process.
- GitHub app installed in your Port account.
Set up data model
When installing the GitHub app in Port, the Repository and Pull Request blueprints are created by default.
However, the Issue blueprint is not created automatically, so we will need to create it manually.
Additionally, we will update the Repository blueprint to include a visibility property, which is not part of the default schema.
Update the repository blueprint
Follow the steps below to update the Repository blueprint:
-
Navigate to the
Repositoryblueprint in your Port Builder. -
Hover over it, click on the
...button on the right, and selectEdit JSON. -
Add the visibility property:
Visibility property (Click to expand)
 "visibility": {
     "type": "string",
     "title": "Visibility"
} -
Click
Save.
Create the Github issue blueprint
We will then create the Issue blueprint.
Skip to the set up data source mapping section if you already have the blueprint.
-
Go to your Builder page.
-
Click on
+ Blueprint. -
Click on the
{...}button in the top right corner, and chooseEdit JSON. -
Add this JSON schema:
GitHub issue blueprint (Click to expand)
{
    "identifier": "githubIssue",
    "title": "Issue",
    "icon": "Github",
    "schema": {
        "properties": {
        "creator": {
            "title": "Creator",
            "type": "string"
        },
        "assignees": {
            "title": "Assignees",
            "type": "array"
        },
        "labels": {
            "title": "Labels",
            "type": "array"
        },
        "status": {
            "title": "Status",
            "type": "string",
            "enum": ["open", "closed"],
            "enumColors": {
            "open": "green",
            "closed": "purple"
            }
        },
        "createdAt": {
            "title": "Created At",
            "type": "string",
            "format": "date-time"
        },
        "closedAt": {
            "title": "Closed At",
            "type": "string",
            "format": "date-time"
        },
        "updatedAt": {
            "title": "Updated At",
            "type": "string",
            "format": "date-time"
        },
        "description": {
            "title": "Description",
            "type": "string",
            "format": "markdown"
        },
        "issueNumber": {
            "title": "Issue Number",
            "type": "number"
        },
        "link": {
            "title": "Link",
            "type": "string",
            "format": "url"
        }
        },
        "required": []
    },
    "mirrorProperties": {},
    "calculationProperties": {},
    "relations": {
        "repository": {
        "target": "githubRepository",
        "required": true,
        "many": false
        }
    }
} -
Click
Saveto create the blueprint.
Set up data source mapping
-
Go to your Data Source page.
-
Select the GitHub integration.
-
Add the following YAML block into the editor to ingest data from GitHub:
GitHub integration configuration (Click to expand)
resources:
- kind: repository
    selector:
    query: 'true'
    port:
    entity:
        mappings:
        identifier: .name
        title: .name
        blueprint: '"githubRepository"'
        properties:
            readme: file://README.md
            url: .html_url
            defaultBranch: .default_branch
            visibility: .visibility

- kind: pull-request
    selector:
    query: 'true'
    closedPullRequests: true
    port:
    entity:
        mappings:
        identifier: .head.repo.name + (.id|tostring)
        title: .title
        blueprint: '"githubPullRequest"'
        properties:
            creator: .user.login
            assignees: '[.assignees[].login]'
            reviewers: '[.requested_reviewers[].login]'
            status: .status
            closedAt: .closed_at
            updatedAt: .updated_at
            mergedAt: .merged_at
            createdAt: .created_at
            prNumber: .id
            link: .html_url
            leadTimeHours: >-
            (.created_at as $createdAt | .merged_at as $mergedAt | ($createdAt
            | sub("\\..*Z$"; "Z") | strptime("%Y-%m-%dT%H:%M:%SZ") | mktime)
            as $createdTimestamp | ($mergedAt | if . == null then null else
            sub("\\..*Z$"; "Z") | strptime("%Y-%m-%dT%H:%M:%SZ") | mktime end)
            as $mergedTimestamp | if $mergedTimestamp == null then null else
            (((($mergedTimestamp - $createdTimestamp) / 3600) * 100 | floor) /
            100) end)
        relations:
            repository: .head.repo.name

- kind: issue
    selector:
    query: .pull_request == null
    port:
    entity:
        mappings:
        identifier: .repo + (.id|tostring)
        title: .title
        blueprint: '"githubIssue"'
        properties:
            creator: .user.login
            assignees: '[.assignees[].login]'
            labels: '[.labels[].name]'
            status: .state
            createdAt: .created_at
            closedAt: .closed_at
            updatedAt: .updated_at
            description: .body
            issueNumber: .number
            link: .html_url
        relations:
repository: .repo -
Click
Save & Resyncto apply the mapping.
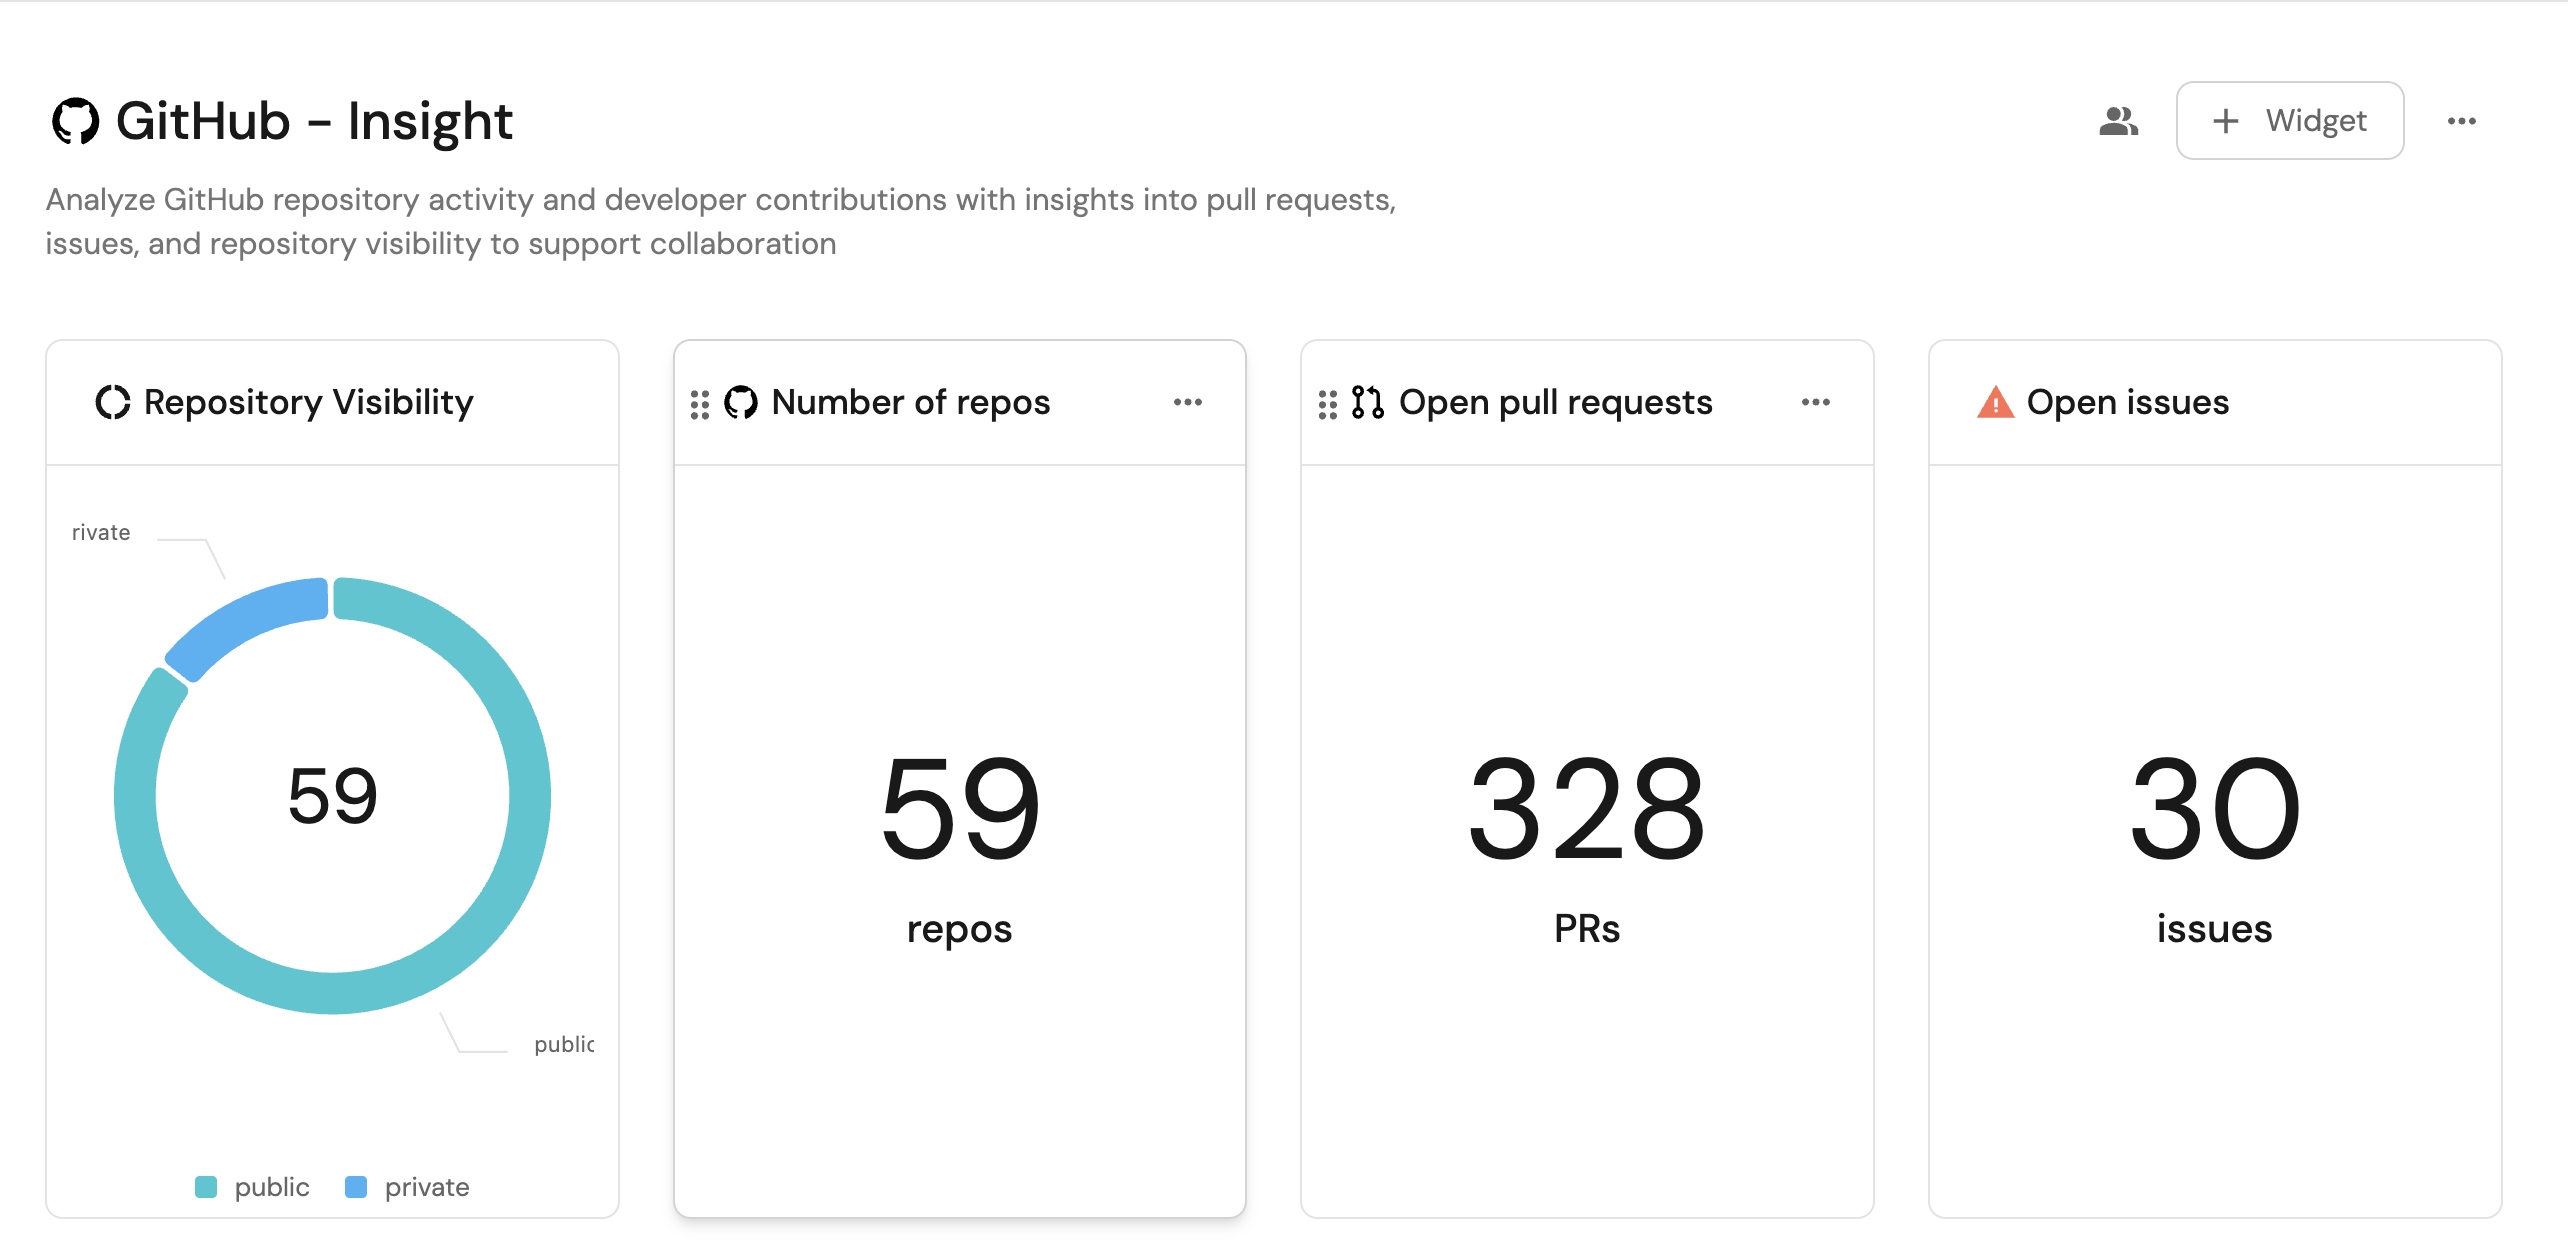
Visualize metrics
Once the GitHub data is synced, we can create a dashboard and add widgets to monitor repository visibility and developer activity.
Create a dashboard
- Navigate to your software catalog.
- Click on the
+ Newbutton in the left sidebar. - Select New dashboard.
- Name the dashboard GitHub - Insight.
- Click
Create.
We now have a blank dashboard where we can start adding widgets to visualize our developer activities.
Add widgets
Repository visibility (click to expand)
-
Click
+ Widgetand select Pie chart. -
Title:
Repository Visibility. -
Choose the Repository blueprint.
-
Under
Breakdown by property, select the Visibility property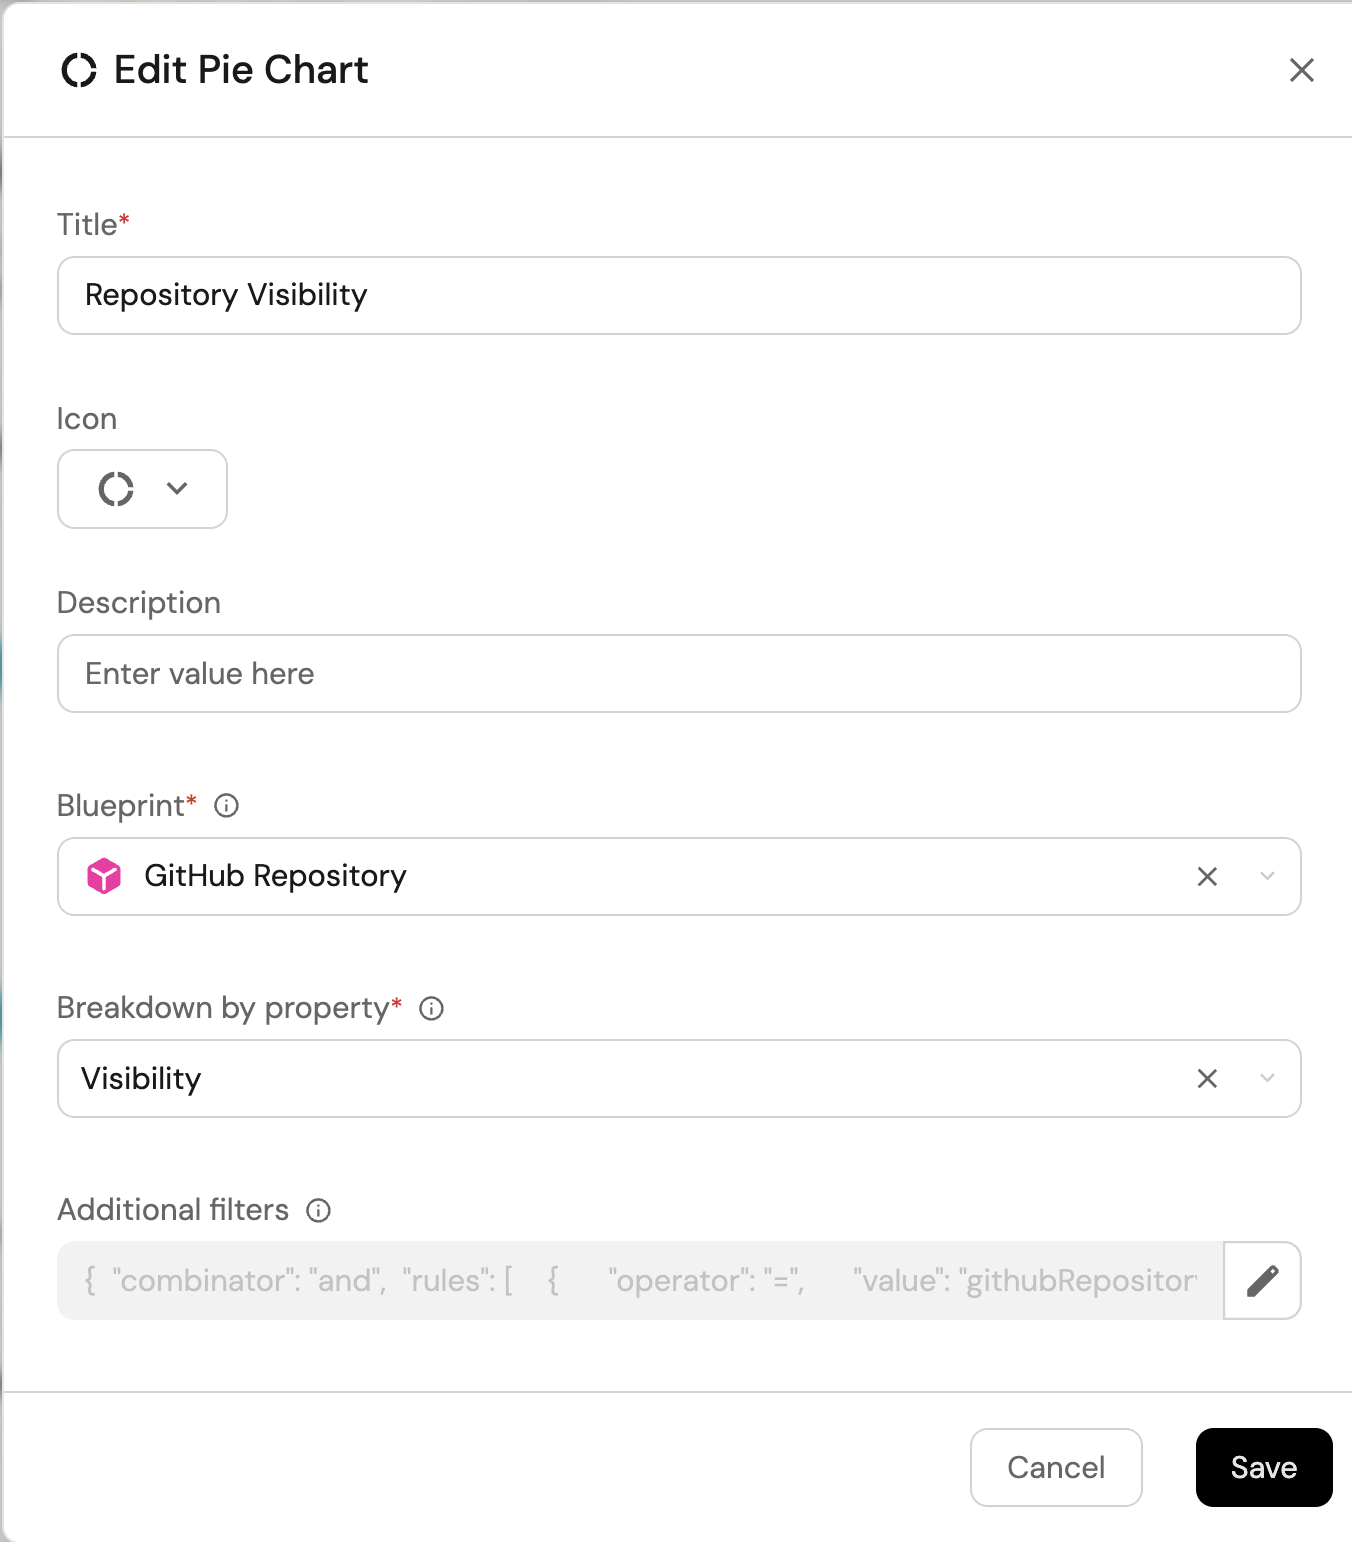
-
Click Save.
Total number of repositories (click to expand)
-
Click
+ Widgetand select Number Chart. -
Title:
Number of repos. -
Select
Count entitiesChart type and choose Repository as the Blueprint. -
Select
countfor the Function. -
Select
customas the Unit and inputreposas the Custom unit.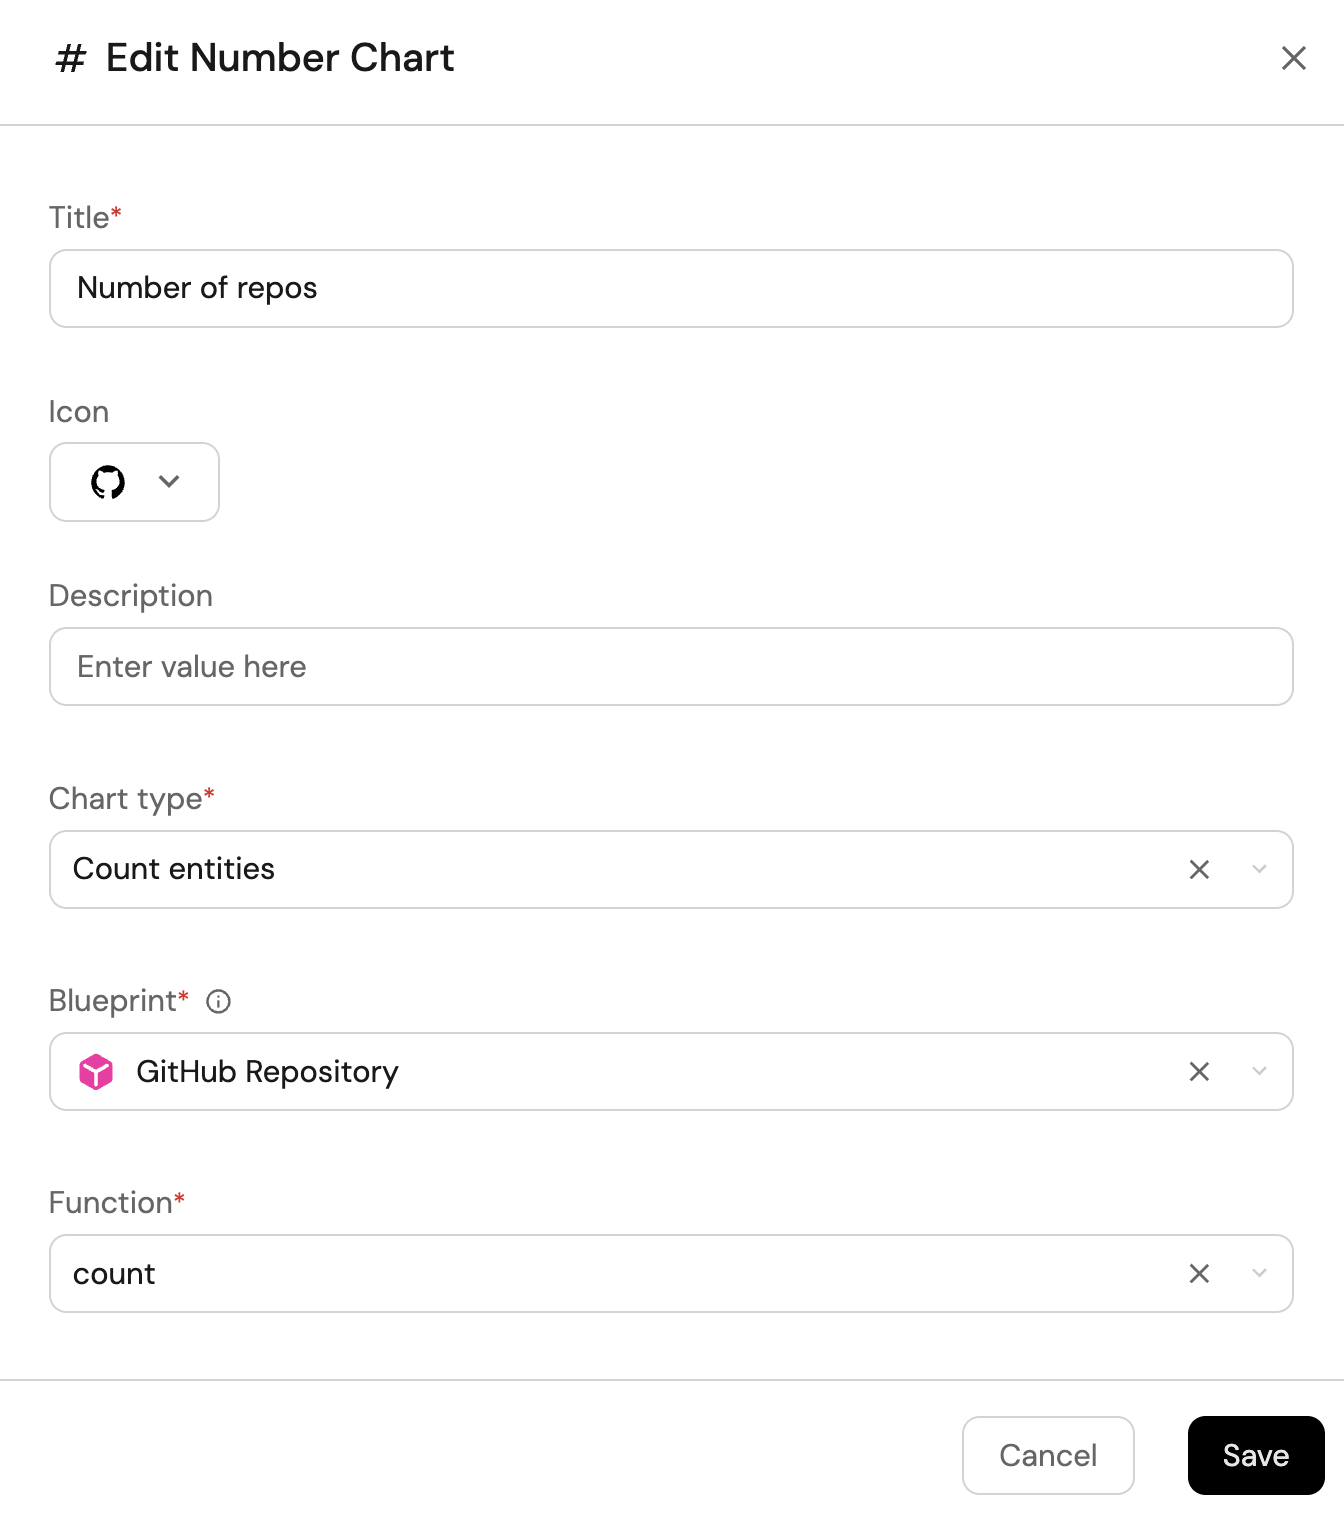
-
Click
Save.
Total number of public repositories (click to expand)
-
Click
+ Widgetand select Number Chart. -
Title:
Public repos(add theUrlicon). -
Select
Count entitiesChart type and choose Repository as the Blueprint. -
Select
countfor the Function. -
Add this JSON to the Additional filters editor to filter
publicrepositories:[
{
"combinator":"and",
"rules":[
{
"property":"visibility",
"operator":"=",
"value":"public"
}
]
}
] -
Select
customas the Unit and inputreposas the Custom unit.
-
Click
Save.
Total number of open pull requests (click to expand)
-
Click
+ Widgetand select Number Chart. -
Title:
Open pull requests(add theGitPullRequesticon). -
Select
Count entitiesChart type and choose Pull Request as the Blueprint. -
Select
countfor the Function. -
Add this JSON to the Additional filters editor to filter
openpull requests:[
{
"combinator":"and",
"rules":[
{
"property":"status",
"operator":"=",
"value":"open"
}
]
}
] -
Select
customas the Unit and inputPRsas the Custom unit.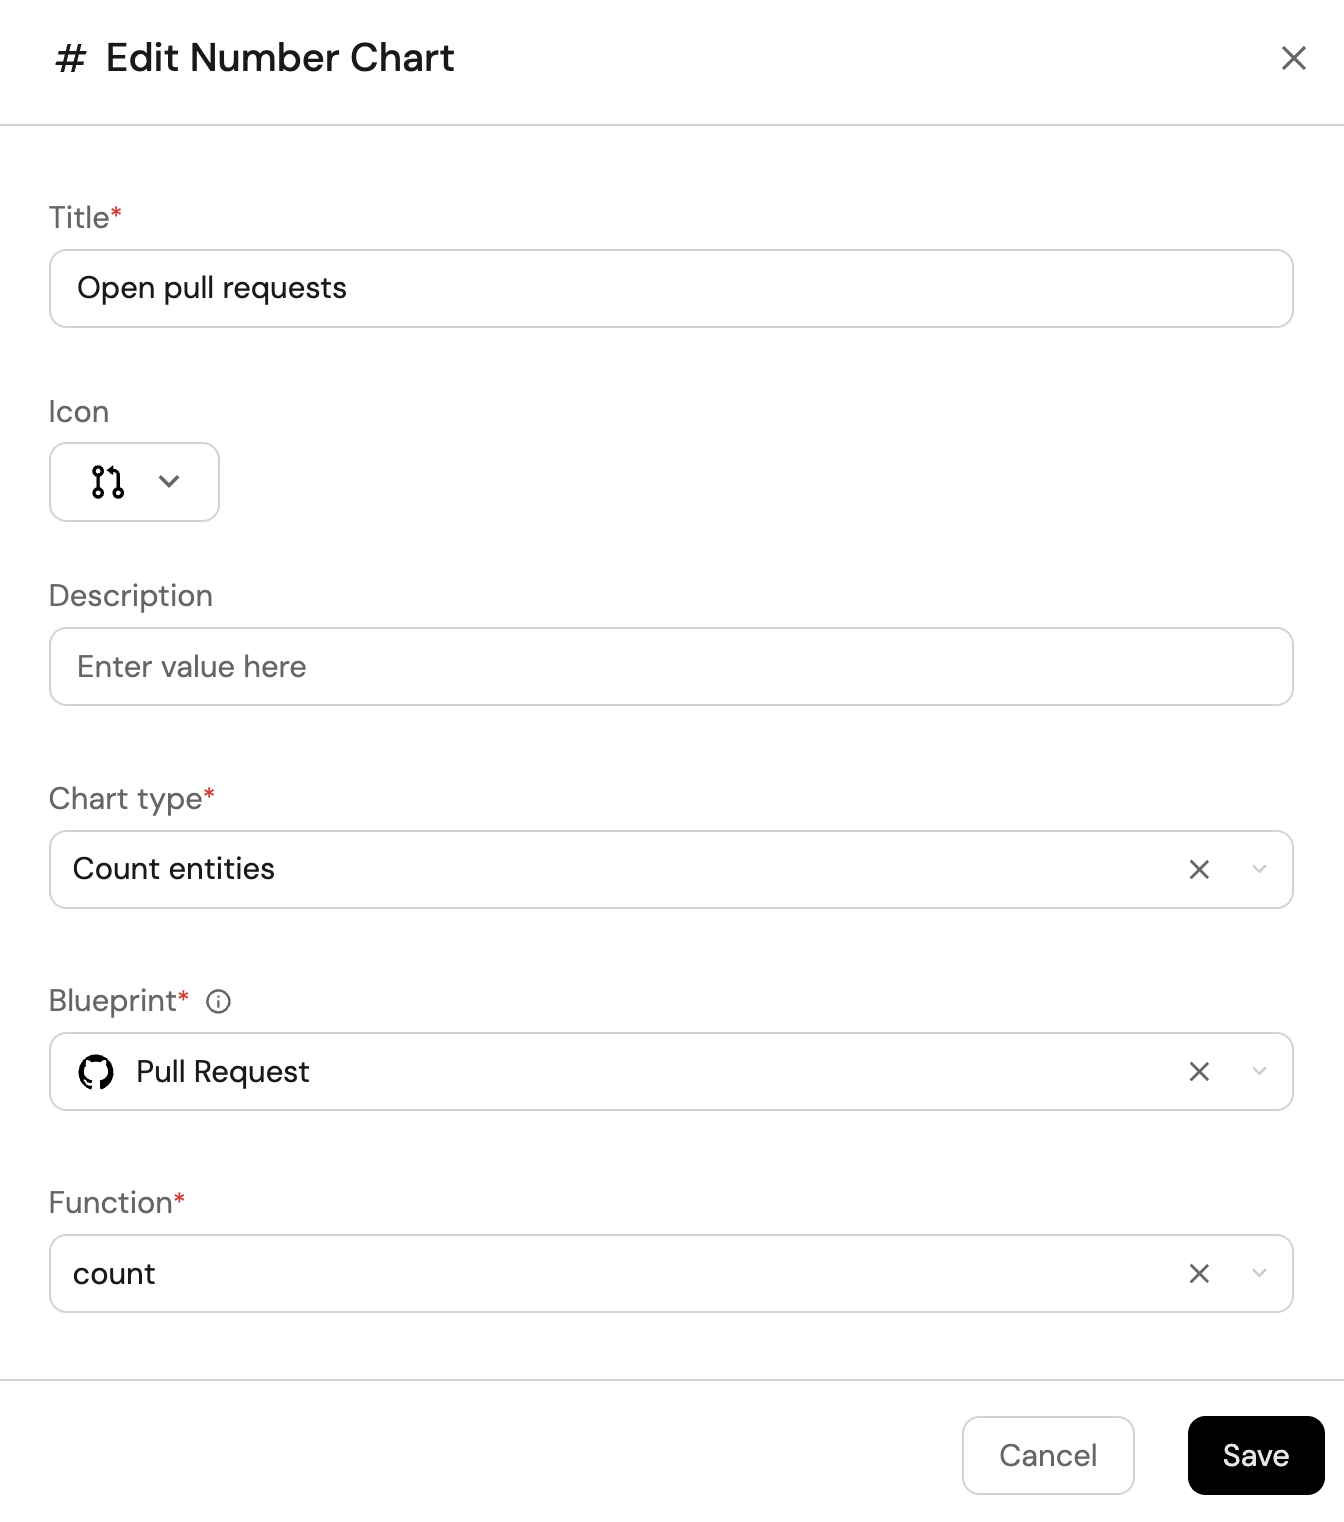
-
Click
Save.
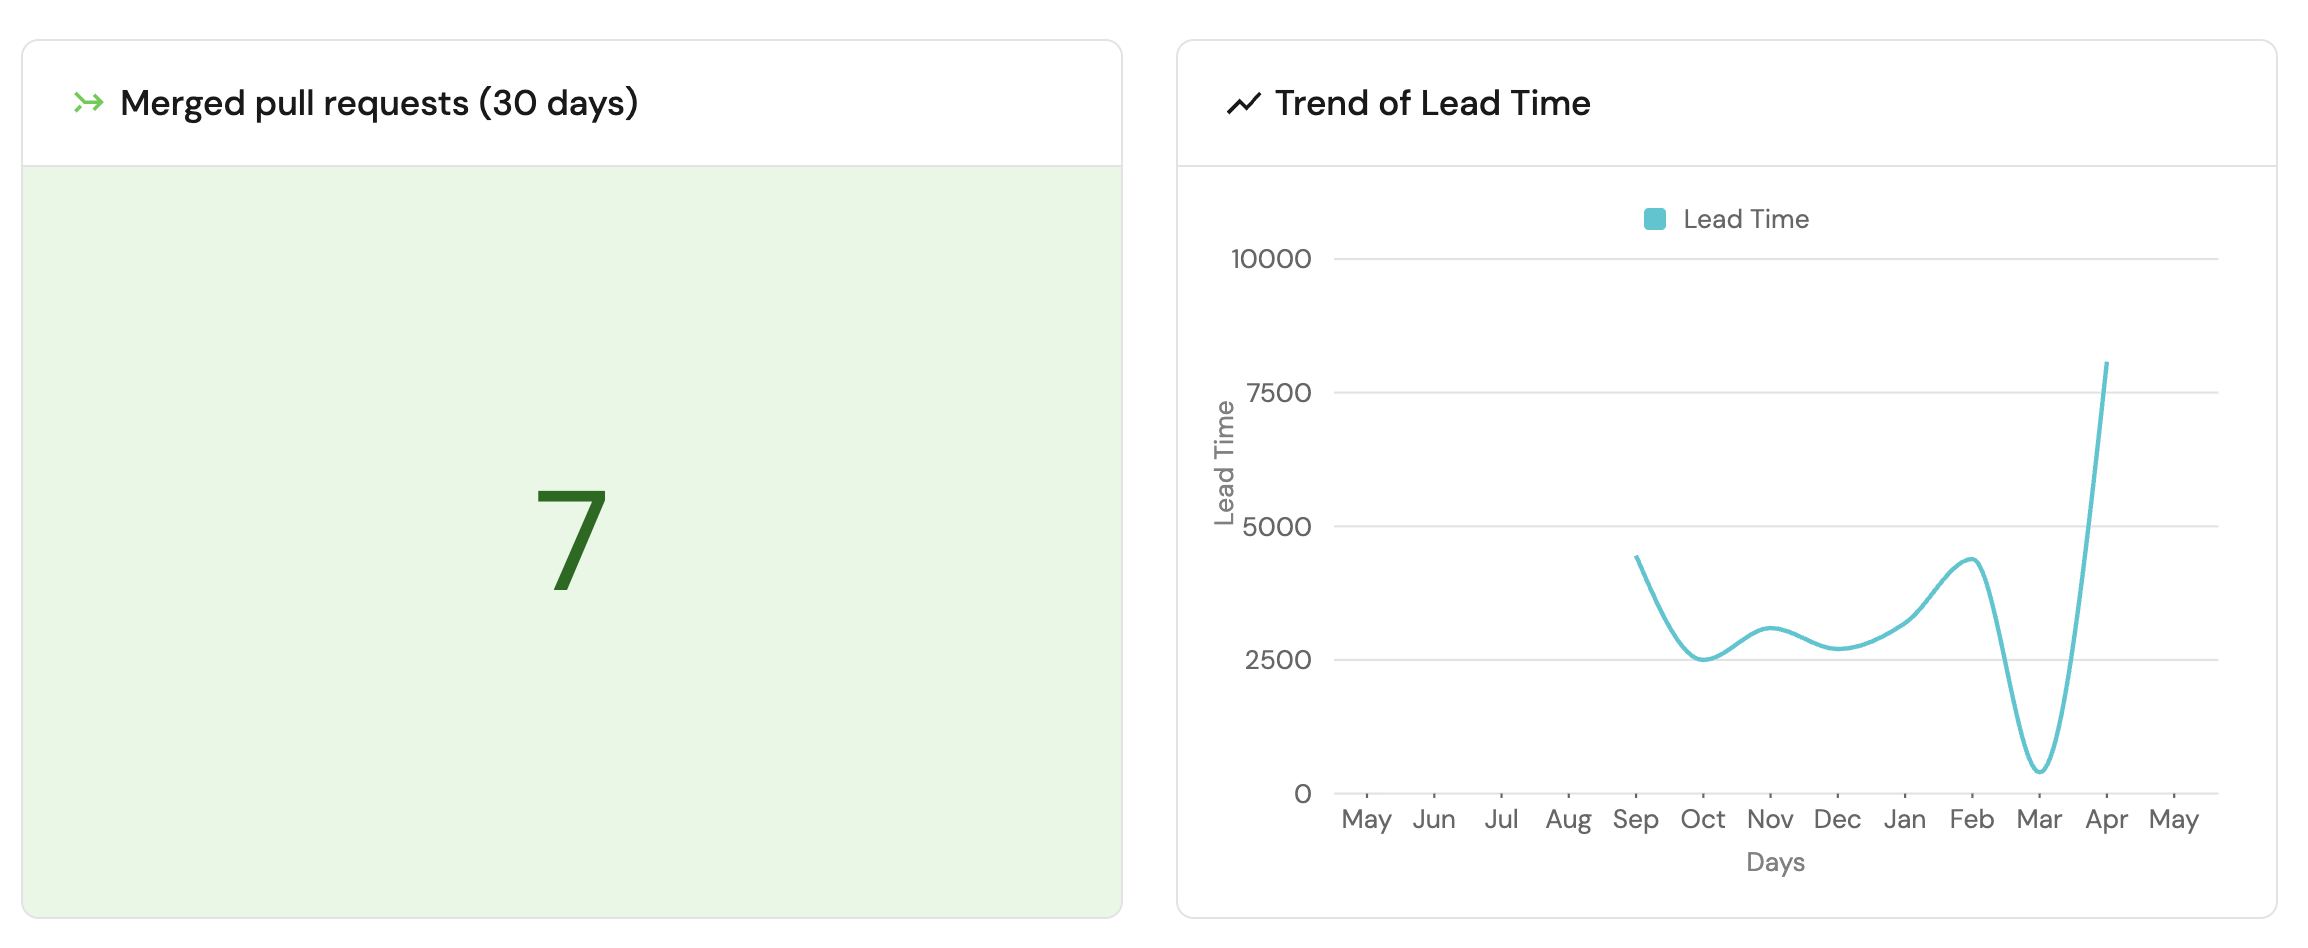
Total number of merged pull requests (click to expand)
-
Click
+ Widgetand select Number Chart. -
Title:
Merged pull requests (30 days)(add theMergeicon). -
Select
Count entitiesChart type and choose Pull Request as the Blueprint. -
Select
countfor the Function. -
Add this JSON to the Additional filters editor to filter
mergedpull requests updated in the last month:[
{
"combinator":"and",
"rules":[
{
"property":"status",
"operator":"=",
"value":"merged"
},
{
"property":"updatedAt",
"operator":"between",
"value":{
"preset":"lastMonth"
}
}
]
}
] -
Select
customas the Unit and inputPRsas the Custom unit.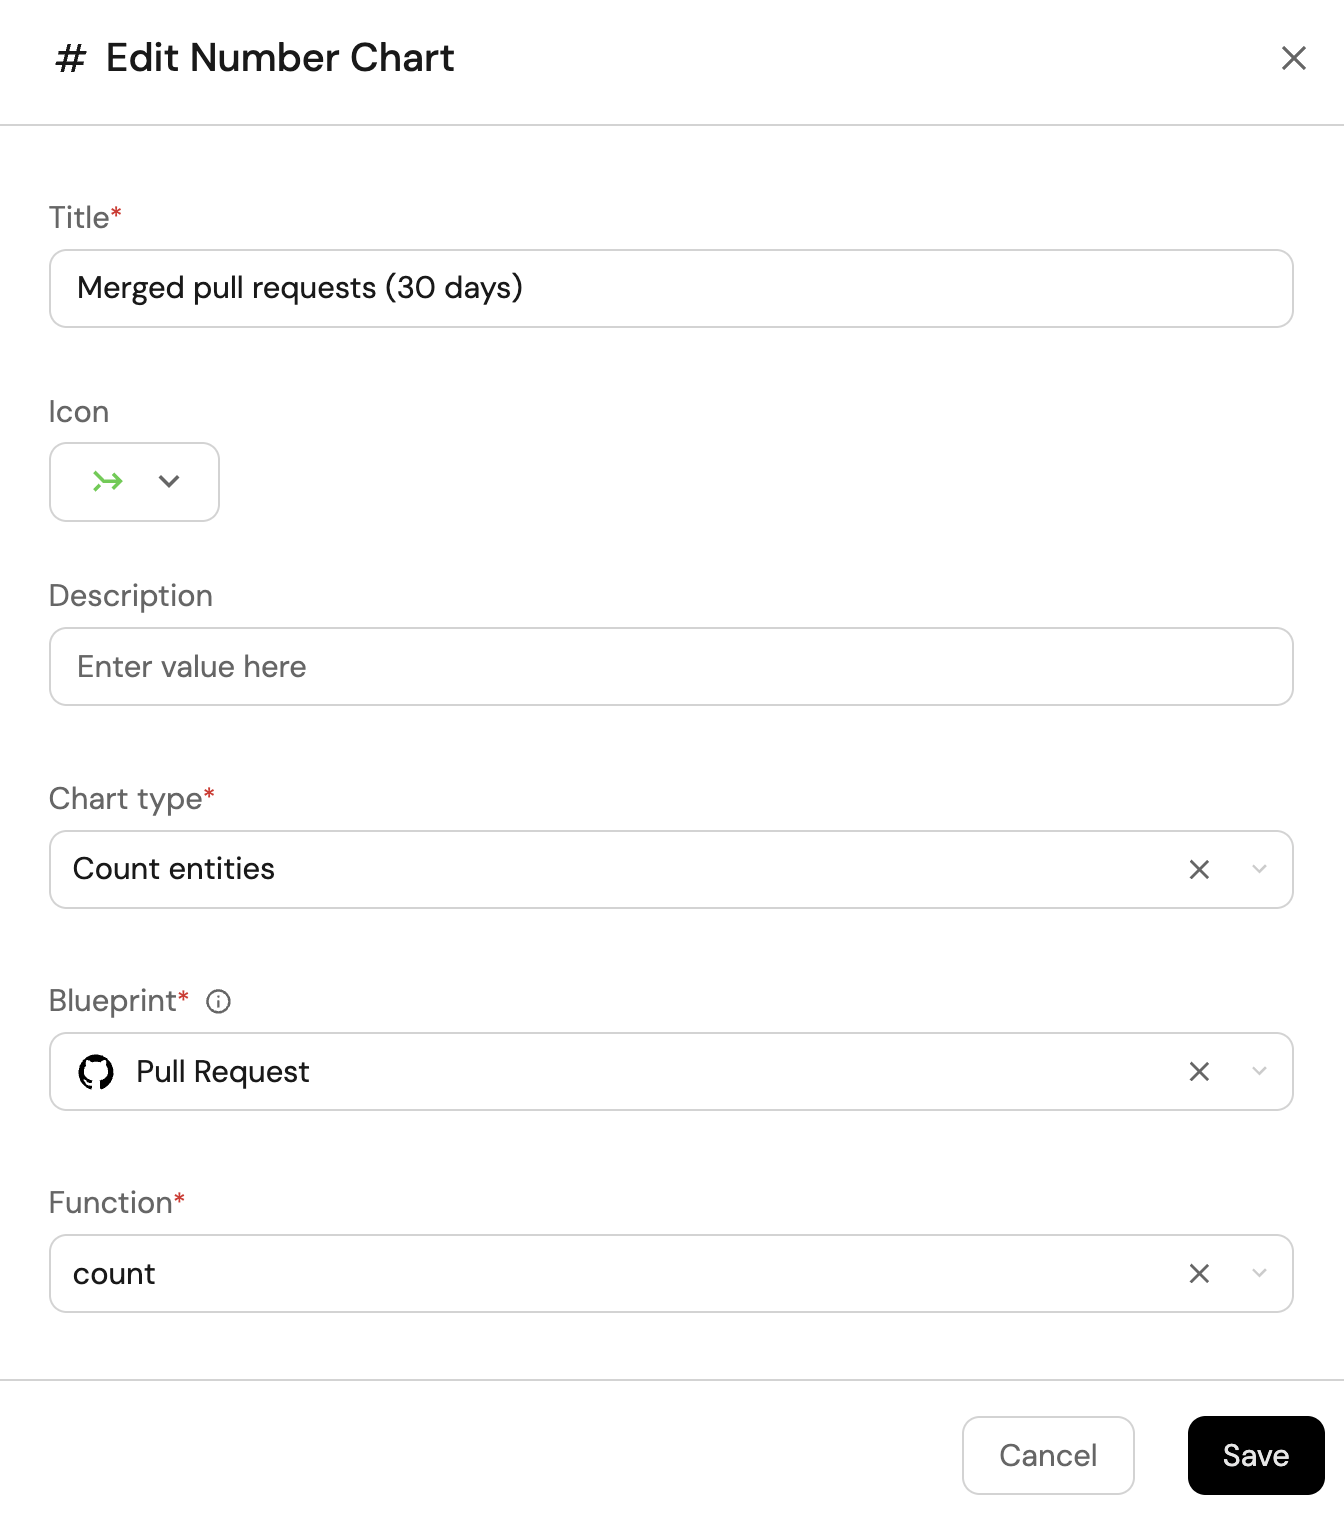
-
Click
Save.
Total number of open GitHub issues (click to expand)
-
Click
+ Widgetand select Number Chart. -
Title:
Open issues(add theAlerticon). -
Select
Count entitiesChart type and choose Issue as the Blueprint. -
Select
countfor the Function. -
Add this JSON to the Additional filters editor to filter
openissues:[
{
"combinator":"and",
"rules":[
{
"property":"status",
"operator":"=",
"value":"open"
}
]
}
] -
Select
customas the Unit and inputissuesas the Custom unit.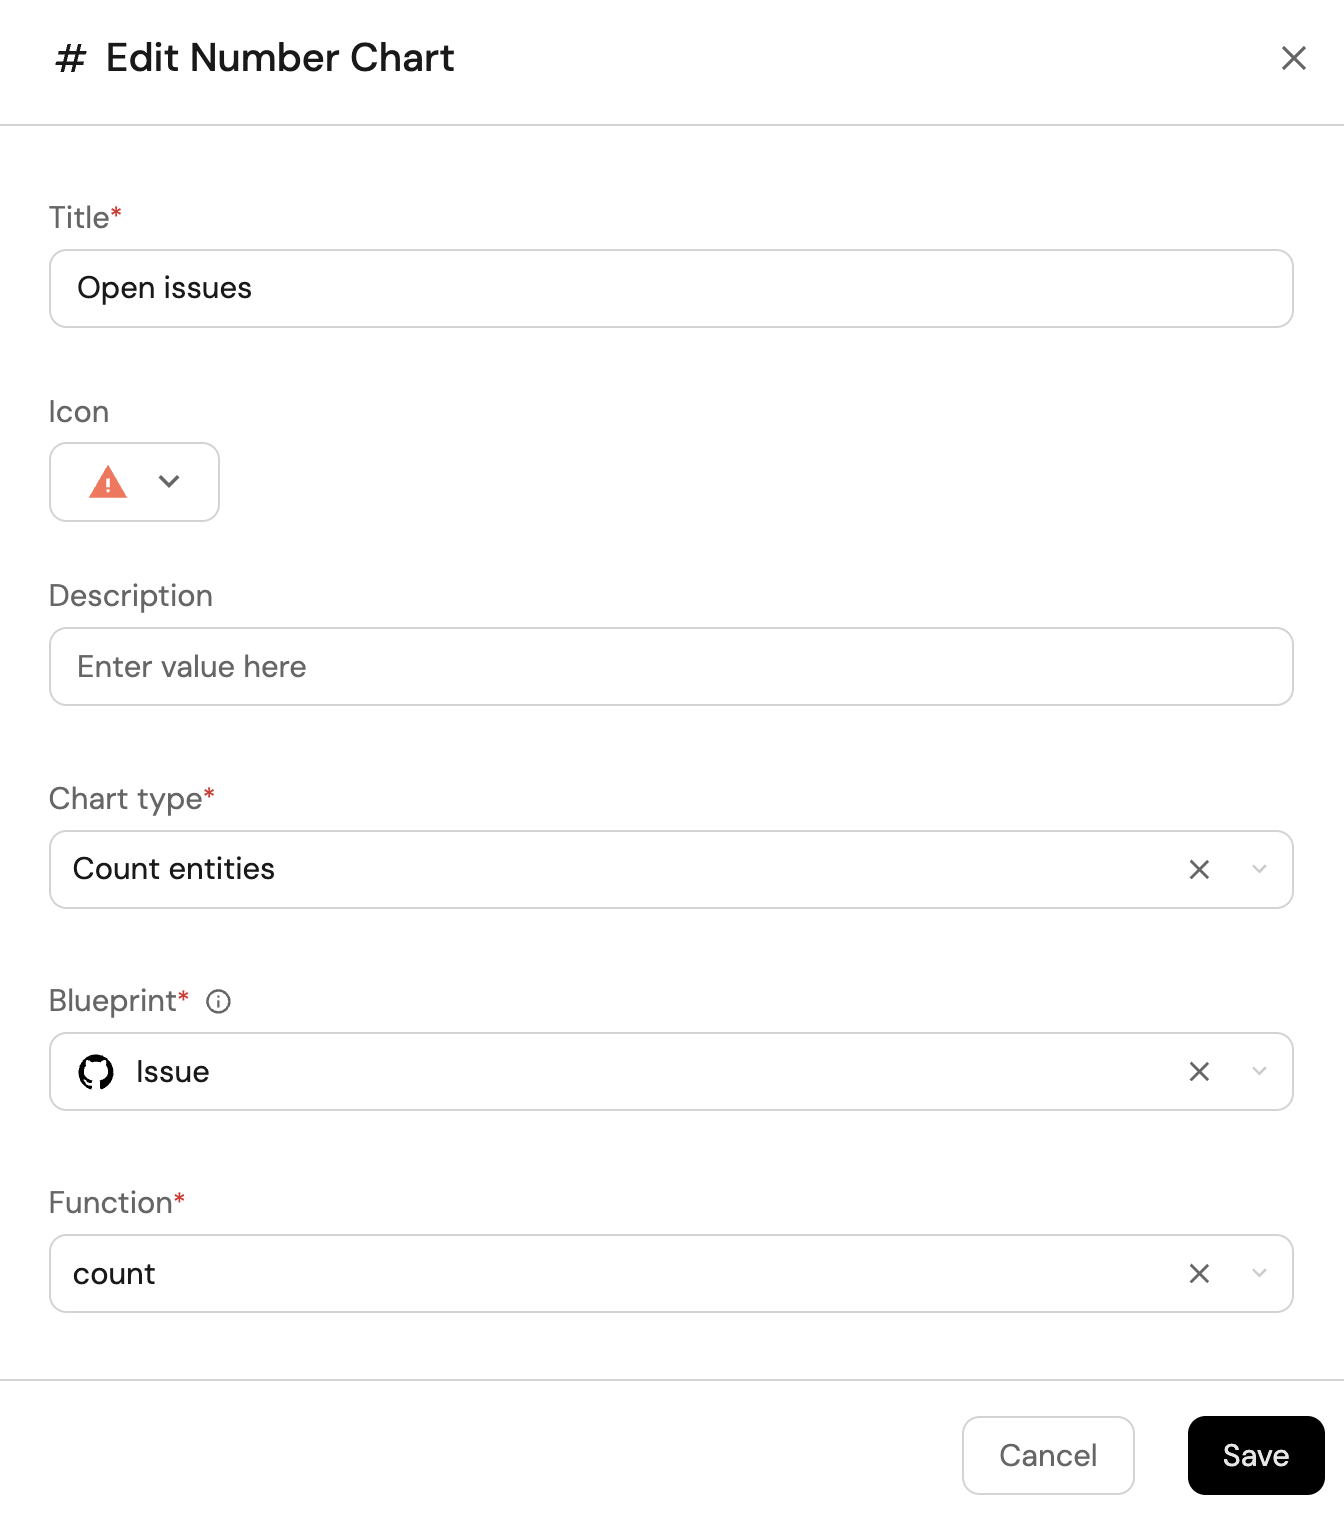
-
Click
Save.